Beyond Churn Rate: 8 Retention Metrics PLG SaaS Should Look At
Product-Led Growth (PLG) SaaS companies live and die by retention. While churn rate is a critical metric, it only tells part of the story. To truly understand how well your product is retaining and expanding customers, you need to look beyond churn.
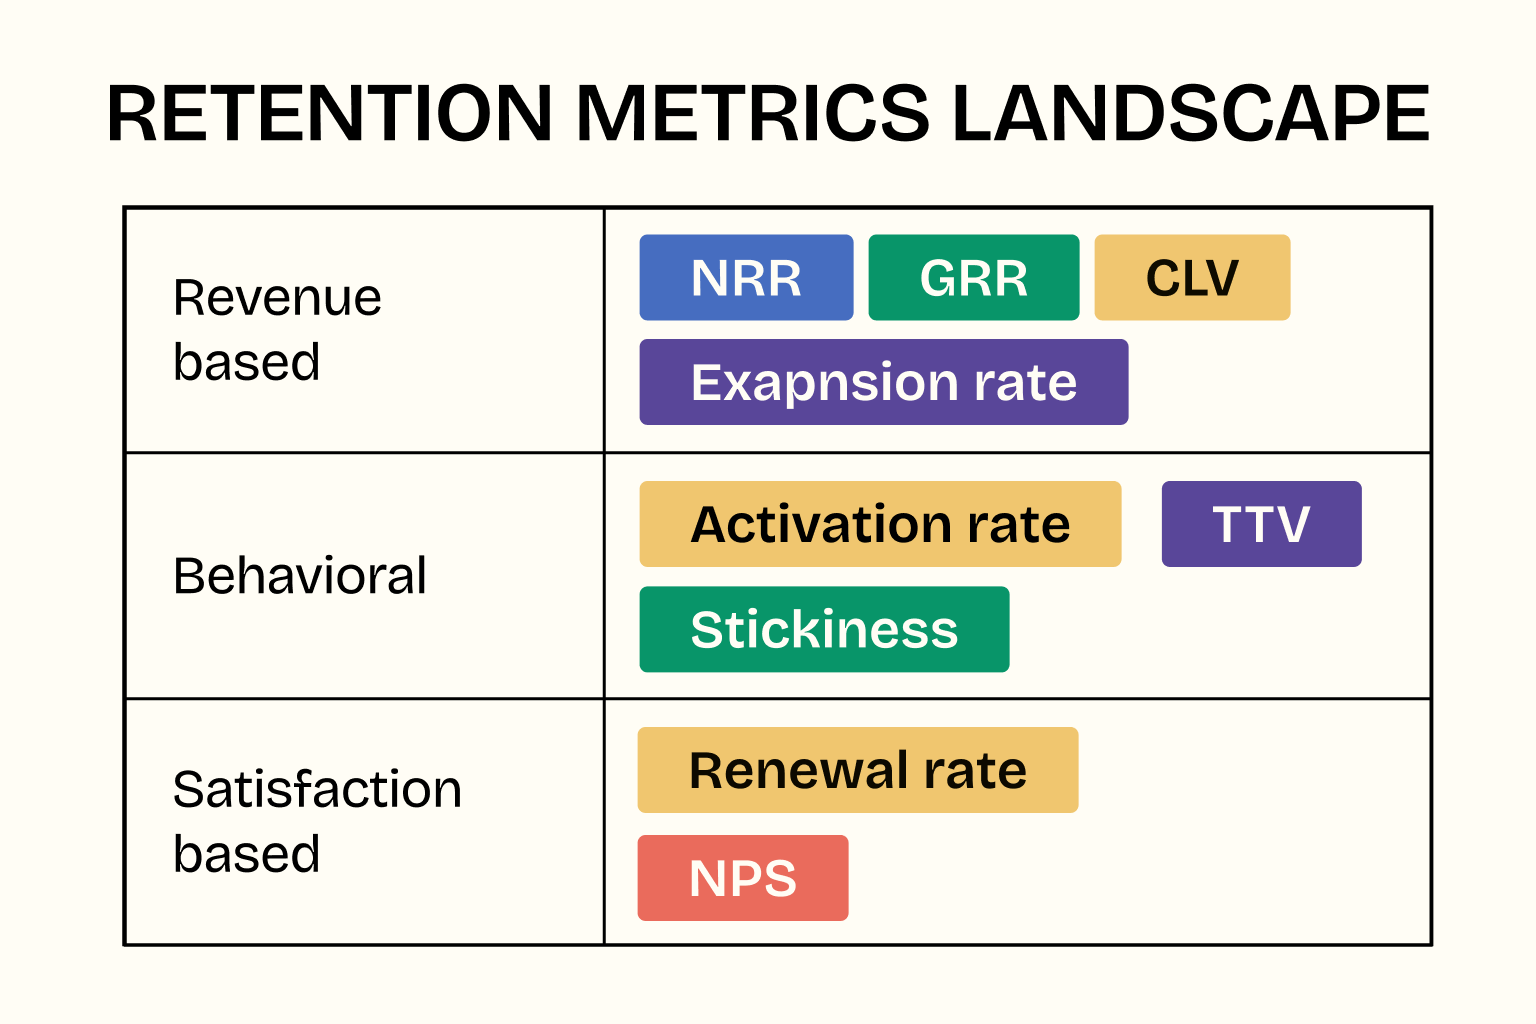
In this post, we’ll explore eight key retention metrics that every PLG SaaS cofounder or customer success leader should track. These metrics provide deeper insight into customer behavior, product value, and growth potential – helping you build a stickier product and a more profitable business.
1. Net Revenue Retention (NRR)
What it is:
Net Revenue Retention (NRR) — also known as Net Dollar Retention (NDR) — measures how your recurring revenue changes from your existing customers over time, accounting for upgrades, downgrades, and cancellations.
Formula:
NRR = ((Starting MRR + Expansion MRR – Churn MRR – Downgrade MRR) / Starting MRR) x 100%
Why it matters:
NRR tells you if your current customer base is a growth engine. When NRR is over 100%, it means that expansions and upgrades from retained customers are more than making up for churn and downgrades. This is a key indicator of product-market fit and the long-term sustainability of your revenue. Snowflake, for example, became the poster child of PLG retention by consistently posting NRR above 160%, thanks to their usage-based pricing and sticky product experience. For PLG businesses, where expansion is often more efficient than acquisition, NRR acts as a critical north star.
Use it to:
- Identify power users and expansion opportunities. Which segments are growing their spend? Double down there.
- Monitor long-term customer value. A rising NRR means your users are getting more value over time.
- Signal product-market fit to investors. High NRR is a growth flywheel, especially important during funding conversations.
2. Gross Revenue Retention (GRR)
What it is:
GRR measures the percentage of revenue retained from existing customers, excluding expansions. It isolates churn and contraction.
Formula:
GRR = ((Starting MRR – Churn MRR – Downgrade MRR) / Starting MRR) x 100%
Why it matters:
GRR is your cleanest look at revenue loss. Unlike NRR, it doesn’t let expansion revenue cover up churn. If GRR is slipping, it means you have a leak in the bucket – customers are leaving or shrinking. It's particularly important for companies with large enterprise contracts or longer-term deals. A company may have 120% NRR, but if GRR is below 80%, it’s a red flag: upsells might be hiding bigger underlying problems.
Use it to:
- Flag deeper churn issues. If your GRR is lagging behind NRR, it’s time to investigate.
- Set a floor for retention expectations. You can’t grow a PLG business on expansion alone if the core is eroding.
- Balance against NRR for a fuller picture. The combination of GRR and NRR helps you prioritize churn-fighting vs. growth strategies.
3. Expansion Revenue Rate
What it is:
Tracks revenue growth from existing customers via upsells, cross-sells, and usage-based growth.
Why it matters:
Expansion revenue is the cornerstone of PLG. It’s significantly cheaper than acquiring new customers and a powerful sign that users are finding increasing value. Take Slack or Zoom, for instance – as teams adopt the tool more broadly, usage and spending naturally grow. According to ProfitWell, companies that prioritize expansion see up to 70% higher LTV per customer. It’s not just a retention strategy – it’s a monetization play.
Formula:
Expansion Revenue Rate (%) = (Expansion MRR / Starting MRR) × 100
Use it to:
- Measure the success of CS and onboarding. Great onboarding = faster value = more expansion.
- Gauge product depth and monetization. Are customers using more features over time?
- Justify PLG motion efficiency. If you’re seeing strong expansion, it means your product is doing the heavy lifting.
Goal: At least 30% of revenue from expansion is a strong sign of PLG health.
4. Customer Lifetime Value (CLV or LTV)
What it is:
Total revenue expected from a customer over their lifespan.
Formula (simple):
CLV = Average Revenue per Customer x Average Customer Lifespan
Why it matters:
CLV gives you a long-term view of your business economics. A higher CLV means customers are sticking around and likely expanding. This gives you more confidence to spend on acquisition or success programs. It also helps you prioritize high-LTV segments. For example, if mid-market customers have a 3x higher CLV than SMBs, you might shift your go-to-market accordingly.
Use it to:
- Decide how much you can afford to spend on acquisition (CAC). Knowing your CLV-to-CAC ratio is essential.
- Guide investment in CS and product. If customers are worth more over time, it’s worth investing in keeping them happy.
Rule of thumb: CLV to CAC ratio should be 3:1 or better. Anything less and you’re likely overpaying for growth.
5. Renewal Rate
What it is:
The percentage of customers or revenue that renews at contract end.
Formula:
Renewal rate = Renewals / Up-for-Renewal Customers
Why it matters:
Renewal rate is the retention heartbeat for contract-based businesses. If customers aren’t renewing, it’s a clear sign of poor product-market fit or weak value delivery. High renewal rates are also the foundation for upsell strategies. Companies like Atlassian track renewal rates by segment and success tier to pinpoint where to invest in success programs.
Benchmark: 80%+ renewal rate is healthy
Use it to:
- Detect retention risk early. If upcoming renewals show a dip, that’s your cue to act.
- Forecast revenue stability. High renewal rates make for predictable revenue, essential for fundraising or planning.
6. Activation Rate & Time-to-Value (TTV)
What they are:
- Activation Rate: % of users reaching the "aha" moment
- TTV: Time it takes to reach that moment
Why they matter:
PLG is all about first impressions. Users need to hit value fast, or they bounce. According to Appcues, users who reach activation within 1 day are 3x more likely to convert to paid plans. Reducing TTV and improving activation increases conversion, retention, and expansion downstream. Airtable and Notion are great at this: both focus on simple, guided onboarding to accelerate TTV.
Use it to:
- Improve onboarding and education. Invest in tooltips, templates, and self-serve guides.
- Track cohort retention curves. Better activation usually leads to better week 1 and week 4 retention.
Example: Define activation as “completed first project” or “sent 5 emails”. Measure what % of new users hit that milestone and how quickly.
7. Product Engagement & Stickiness
What it is:
Behavioral usage data post-onboarding. Key signals include:
- DAU/WAU/MAU
- Feature adoption
- Time in app
- Stickiness Ratio = DAU / MAU
Why it matters:
Engagement is the clearest sign of value. If users aren’t logging in, they’re on the path to churn. Metrics like DAU/WAU or stickiness help you quantify usage patterns and intervene when they drop. Tools like Mixpanel and Amplitude make it easier to spot these trends. Figma, for example, used DAU/MAU as a key internal metric to prove their product was becoming an everyday design tool.
Use it to:
- Guide CS outreach. Low usage? Time to check in.
- Inform product improvements. Usage patterns reveal what’s working and what’s not.
- Build Customer Health Scores. Combine usage with support data and NPS for predictive insights.
8. Net Promoter Score (NPS)
What it is:
Survey asking, "How likely are you to recommend us to a friend?" on a 0–10 scale.
Why it matters:
NPS captures sentiment in a simple number. But more importantly, it helps you prioritize customer success efforts. Promoters are prime for referrals and upsells. Detractors are churn risks. Companies like Segment track NPS by cohort and product area to guide roadmap prioritization. And when paired with qualitative feedback, it gives you the "why" behind retention and churn.
Benchmark:
- 30 = Good
- 50 = Excellent
Use it to:
- Spot issues before churn happens. A declining NPS is a leading indicator.
- Prioritize feedback from detractors. Turn complaints into roadmap wins.
- Pair with usage data for richer insights. Low usage + low NPS = trouble.
Benchmarks at a Glance
So you can quickly compare how you stack up against the industry in each of these.
| Metric | Benchmark / Goal |
|---|---|
| Net Revenue Retention (NRR) | >100% (Best-in-class: 130%–160%+) |
| Gross Revenue Retention (GRR) | ~90%+ |
| Expansion Revenue Rate | 30%+ of total revenue |
| Customer Lifetime Value (CLV) | CLV:CAC ratio of 3:1 or better |
| Renewal Rate | 80%+ |
| Activation Rate | Depends on product, aim for consistent month-over-month improvement |
| Time-to-Value (TTV) | As low as possible; <1 day is ideal |
| Product Stickiness (DAU/MAU) | >20% = decent, >50% = excellent |
| Net Promoter Score (NPS) | >30 = Good, >50 = Excellent |
These benchmarks will vary depending on your stage, market, and product complexity—but they offer solid targets to work toward. They’re also helpful references for aligning teams and setting goals that go deeper than “just reduce churn.”
Final Thoughts
Churn rate alone can’t capture the full story. If you're building or scaling a PLG SaaS company, tracking these 8 metrics will give you a much clearer picture of retention and customer health:
- NRR & GRR tell you what’s really happening with revenue
- Expansion & CLV show the upside of happy customers
- Activation, engagement, and NPS tell you why people stick around
Retention isn’t just about avoiding loss – it's about creating compounding growth. Look beyond churn, and you'll find the levers to build a product that keeps winning long after the signup.