Customer Health Score 2026: Why AI Changes Churn Prediction
If you're running a PLG SaaS with more customers than your team can monitor one-by-one, you already know the core problem a customer health score is supposed to solve: you want to know which customers are quietly on their way out before they tell you.
Most health scoring articles stop at the definition — "aggregate product usage, support tickets, and engagement into a single number." That's the easy part. The hard part is the part nobody writes about: which signals actually predict churn, why hand-built scores keep drifting, and when it stops making sense to maintain weights manually at all.
This article covers the full picture — what a customer health score is, which data inputs genuinely move the needle, the two architectures for building one (rule-based vs. AI), and how to use the score for something other than a dashboard no one looks at.
What is a customer health score?
A customer health score is a single metric — usually a number, letter, or color — that summarizes how likely a customer is to renew, expand, or churn based on the signals they're sending through your product, billing, and support systems. It sits in the same family of scoring tools as the customer scoring matrix, but where the matrix is a 2×2 snapshot of fit and engagement, a health score is a dynamic metric that changes daily based on behavior.
A health score is not a CSAT survey. It's not an NPS. It's a composite of behavioral data — did they log in this week, are they using the features they signed up for, are their invoices paying on time, are they opening support tickets about workflows they used to understand — rolled up into one value that your team can sort, filter, and act on.
The goal is simple: catch the churn signal while you can still do something about it.
The rest of the article is about the things that determine whether your score is actually good at that job, or just a number on a dashboard.
Why most customer health scores don't work
Here's what we see over and over when teams show us the health score they built themselves — usually in a spreadsheet, Mixpanel dashboard, or a homegrown layer on top of HubSpot:
The weights were set once and never recalibrated. Someone picked "logins per week" as 30% of the score in 2024. In 2026 your product has a completely different activation pattern — maybe the API replaced the UI for power users, or a new feature shifted engagement to weekly cadence. The score is now measuring something that used to matter.
The signals are vanity, not predictive. Tracking "daily active users" feels rigorous. But DAUs don't predict churn in most SaaS products — what predicts churn is the trend of engagement relative to a customer's own baseline. A customer who went from daily to weekly logins in month three is churning; a customer who's always been weekly is fine. Flat DAU tracking can't tell them apart.
The score produces false positives. This is one of the most common searches we see around health scoring — "why do our customer health scores keep producing false positives?" Usually it's because the model flags every customer whose usage dipped below a rule threshold, without considering whether that dip is normal for their segment, lifecycle stage, or billing cycle.
Nobody uses it. The score sits in a Looker dashboard. Nobody reviews it in Monday standups. When a customer does churn, the post-mortem rarely references what the score said two weeks before.
The underlying problem: a customer health score is only useful if it changes what your team does. If the score is accurate but no workflow fires from it, it's just data. If a workflow fires from it but the score is noisy, you're annoying customers with reactive outreach. Both patterns are why most health scoring projects get abandoned within a year.
What the data says about churn signals
Before we get into how to build a better score, here's the evidence base for what to look for. These numbers come from transactional benchmark data across B2B SaaS (Baremetrics, Recurly, ChartMogul) — not survey data.
- 70–80% of customers who churn show clear warning signs 30 or more days before they cancel. The most common signal is a 30%+ month-over-month drop in login frequency or feature engagement.
- 97% of churning customers never contact support before canceling. Silent churn is the default, not the exception. Waiting for tickets means waiting until after the decision.
- 40–60% of SaaS cancellations happen within the first 90 days. If your scoring model gives equal weight to every customer regardless of tenure, it will miss most of its prediction target — because most churn is happening in a window where most signals haven't stabilized yet.
- Customers who switch from annual to monthly billing are themselves a leading churn indicator. Billing pattern changes are one of the highest-signal, lowest-latency data points available — and most health scores ignore them because they live in Stripe or Chargebee, not in the product analytics tool.
- 86% of customers are more likely to stay when onboarding is clear. Which means onboarding friction is both a churn driver and a signal: customers who don't complete core setup milestones are telling you something.
- Healthy monthly revenue churn for SMB B2B SaaS sits at 3–7% annual. If your health score is flagging 30% of your accounts as at-risk, the score is calibrated wrong — you're producing noise your team will learn to ignore.
These five numbers are the kind of thing most health scoring guides don't include. They're also the reason rule-based scoring hits a ceiling: the signals that matter (trend vs. baseline, billing pattern shifts, onboarding completion by cohort) are hard to capture in a weighted sum of thresholds. For a deeper look at how these signals translate into churn prediction, see our guide on how to spot churn risk before it's too late.
The data inputs that actually predict churn
A strong customer health score combines three categories of data. If you're missing one of them, you're scoring partial reality.
1. Product usage (required)
This is where the earliest churn signals live. Not absolute usage — trend usage.
- Engagement trend vs. baseline. A customer's usage compared to their own 30- and 90-day rolling average. This catches the "went from daily to weekly" pattern that flat metrics miss.
- Feature adoption breadth. How many of the core features for their plan tier are they actually using? Customers on 2 of 10 core features at month 6 churn at measurably higher rates than those on 6 of 10.
- Activation milestones completed. Especially in the first 30–90 days. An account that never completes onboarding is functionally pre-churned.
- Power user density. Number of active seats vs. paid seats. Shadow seats (paid but unused) are expansion and churn indicators simultaneously.
Connect your product analytics — Mixpanel, PostHog, Amplitude, or Segment — to the scoring layer. If your product is analytics-dark, this data needs to come from the database or event streams directly. Our guide on retention metrics PLG SaaS should look at covers which usage metrics correlate most strongly with retention in product-led companies.
2. Billing data (required)
Billing is the most under-used data source in most health scores, and the one with the highest signal-to-noise ratio.
- Billing cadence changes. Annual-to-monthly downgrades are a churn leading indicator. Monthly-to-annual upgrades are an expansion leading indicator.
- Payment health. Failed payments, retries, dunning states. Soft declines (insufficient funds, temporary holds) are roughly 60–70% of all payment failures and are retryable — but they also correlate with engagement drops.
- Plan changes and seat changes. Downgrades and seat reductions are often the last signal before cancellation.
- Renewal proximity. Accounts within 60 days of renewal need different weighting than accounts 8 months out. Time-to-renewal should be a dimension of the score, not a filter applied after. Net Revenue Retention is the board-level metric this ultimately rolls up to — see our NRR guide for how health scoring feeds into retention reporting.
Stripe and Chargebee are the two most common sources. Even billing data alone — without product usage — gives you a usable signal set.
3. CRM and support data (optional, useful)
This is the context layer. On its own, it's weak. Combined with usage and billing, it resolves ambiguous cases.
- Support ticket sentiment and volume trend. Rising ticket volume can signal friction; falling volume can signal disengagement — which interpretation matters depends on the rest of the score.
- CSM activity history. When was the last meaningful touch? Did the account have an owner change recently?
- Relationship data. Champions leaving (detectable through CRM contact changes) is a strong churn predictor at mid-market and up.
HubSpot, Salesforce, Intercom, and Freshdesk are the usual sources.
The combination matters more than any single input. A customer whose support tickets are rising and whose usage is flat and whose billing just went annual→monthly is a fundamentally different risk profile than a customer with only one of those signals. Rule-based scores can handle this with enough if/then logic. AI scores handle it natively — which brings us to the architecture question.
Rule-based vs. AI customer health scoring
There are two ways to build a customer health score. Both work, and they're not mutually exclusive — most mature teams end up running both. But they solve different problems and they fail in different ways.
Rule-based (manual) customer health scoring
You define the signals that matter. You assign weights. You set thresholds. You categorize customers by score.
This is the approach every health scoring article you've read describes. It's also what most CS platforms (Gainsight, Totango, ChurnZero) support natively — you build a scoring model inside their UI, they execute it.
Where it works:
- Your customer base is homogeneous — similar segments, similar lifecycle, similar usage patterns
- You have strong domain knowledge about what drives churn in your specific product
- Your team will actively maintain and recalibrate the model (quarterly minimum)
- You need full transparency into why a score is what it is
Where it breaks:
- You have heterogeneous customers (multiple segments, products, billing models) — the weights that work for one segment actively mislead on another
- Your product changes faster than you can recalibrate the model
- You don't know upfront what drives churn and need the model to surface patterns you haven't seen yet
- You're drowning in false positives because thresholds are brittle ("below 10 logins per week = at risk" is true for some plans, nonsense for others)
AI customer health scoring
The model learns from your actual data — which customers churned, which signals preceded those churns, which patterns don't predict anything — and assigns scores based on what the data says matters, not what you think matters.
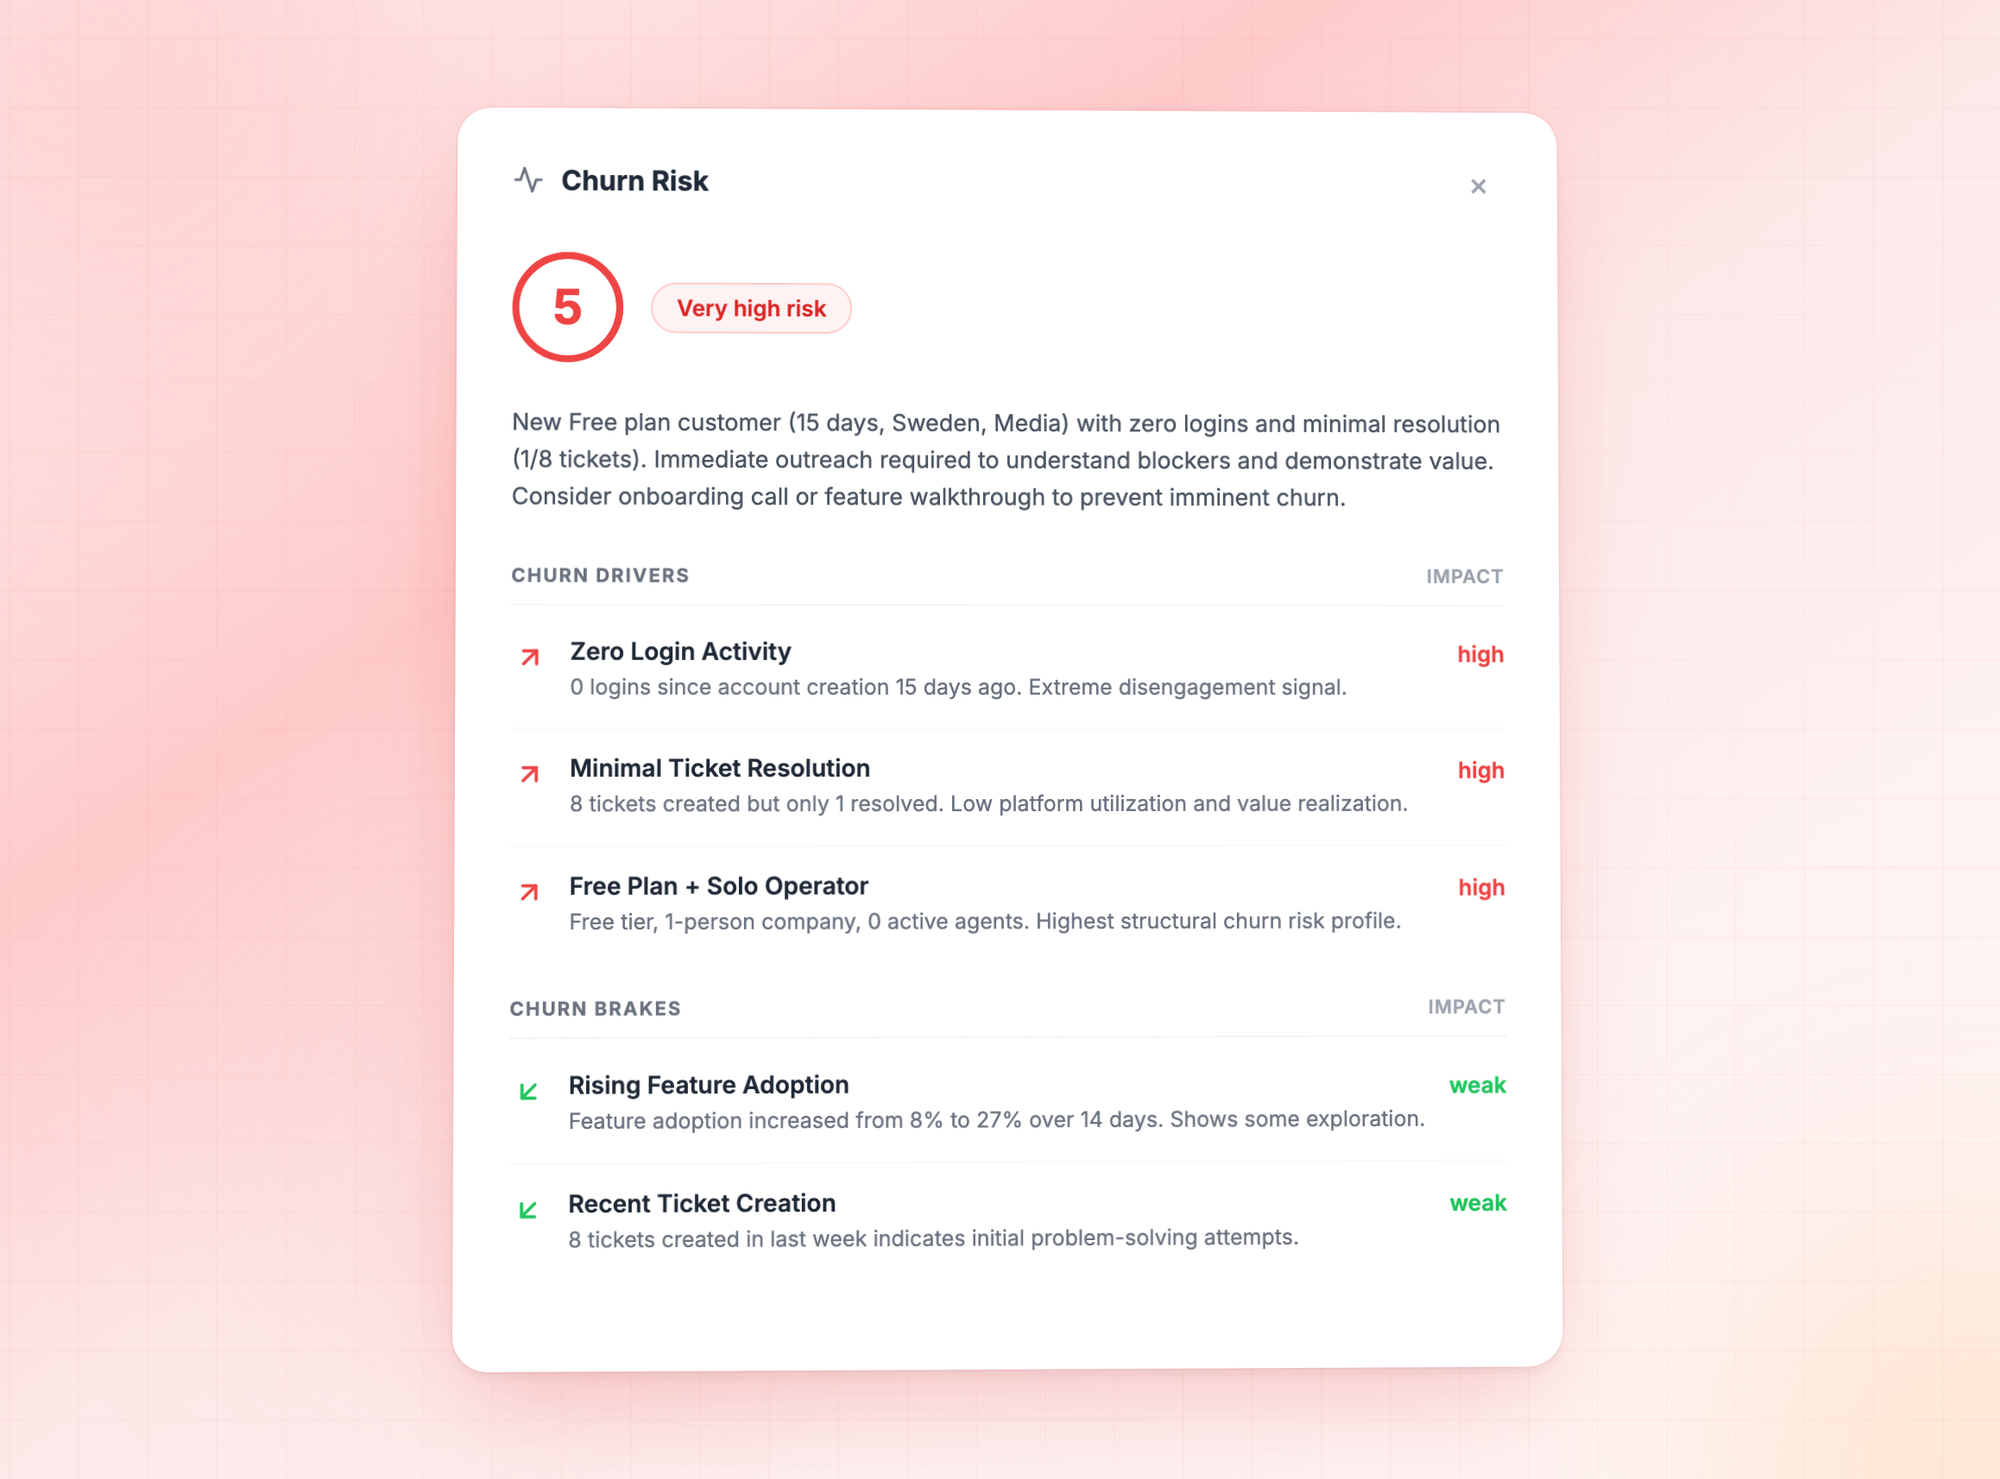
This is what CustomerScore.io's AI Health Scoring does. The architecture: a deep-dive analysis runs per customer across all connected data sources (billing, product usage, engagement, support), and a daily scoring pass evaluates each customer against the latest data. Each customer gets a 1–5 score (1 = healthy, 5 = high churn risk), up to three specific risk drivers, up to three health drivers, and a natural-language explanation of what's moving the score.
Where it works:
- You have at least 2 months of historical data and 40+ historical churn events for the model to learn from
- Your customer base is varied enough that rule-based scoring produces noisy results
- You want the score to adapt as your product and customer base evolve, without someone tuning it
- You want per-customer explainability ("their score is 4 because feature X usage dropped 60% in the last 30 days") instead of rule attribution ("score is low because rules 3, 7, and 12 triggered")
Where it breaks:
- You have fewer than ~100 active customers or very few historical churns — not enough data for the model to find patterns
- You need the scoring logic to be hand-auditable for regulatory reasons (financial services, healthcare)
- You want to explicitly override what the model thinks matters because you know something the data doesn't show
| Manual / Rule-Based Scoring | AI Customer Health Scoring | |
|---|---|---|
| Setup | You define metrics, weights, and thresholds | Automatic — the model learns from your data |
| Maintenance | Requires regular recalibration as your business evolves | Auto-adjusts as new data comes in |
| Explainability | Shows which rules triggered | Shows specific per-customer drivers and brakes |
| Adaptability | Doesn't adapt to new patterns, segments, or seasonal changes | Continuously learns from changing data |
| Prerequisite knowledge | You need to know upfront what drives churn | The model discovers what drives churn from your data |
| Minimum data | None — works on day one with your assumptions | ~2 months history, ~40 historical churns for best accuracy |
Most teams we work with end up running both. The rule-based score reflects domain knowledge ("we know this segment always dips in Q3 and that's not churn") and the AI score acts as an early-warning layer that catches patterns humans haven't coded for yet. The two scores disagreeing is often more informative than either one alone.
How to build a customer health score that actually gets used
Whether you go rule-based or AI, the score is only useful if it drives action. Here's the minimum workflow to make a health score operational. (For a longer, PLG-specific walkthrough, see our step-by-step guide to scoring customers in PLG SaaS.)
1. Define what the score is for
A score that tries to predict both churn and expansion at the same time does both poorly. Pick one primary use case. For most PLG teams, it's churn risk — everything else (prioritization, renewals, expansion) is downstream.
2. Pick the 3–5 signals that matter most
Not 15. Rule-based scores with 15 inputs become impossible to interpret when they're wrong. For most B2B SaaS companies, the highest-signal inputs are: engagement trend vs. baseline, activation milestone completion, billing cadence or payment health, and time-to-renewal. Everything else is refinement.
3. Calibrate against actual churn
This is the step teams skip. Pull your last 6 months of churned accounts. Run your proposed score against them. Does the score flag them ≥30 days before they churned? If no, your weights are wrong or your signals don't include the ones that actually predicted this churn. Iterate before you go live.
4. Tie scores directly to actions
A score that doesn't fire a workflow is decoration. The minimum setup:
- Score moves from 2 to 4: Trigger a personalized check-in email sequence and create a task in your CRM for the account owner
- Score hits 5: Escalate to a human — Slack alert, CSM task, or founder notification depending on deal size
- Score improves from 4 to 2: Log the change, note what preceded it — this is your win playbook source material
- Every account with score 4+ for more than 14 days: Create a win-back or save play
5. Review the score against reality, monthly
Every month, take the top 20 accounts the score flagged and the top 20 it didn't. Compare against what actually happened. If the score missed a churn or flagged a healthy customer as at-risk, figure out which signal broke — and either retrain (AI) or recalibrate (rules).
How customer health scoring fits into a retention system
The score itself is the diagnostic layer. It tells you who to worry about. You still need the other three layers to close the loop:
- Signal layer: clean, connected data across product analytics, billing, CRM, and support. Without this, no score is reliable.
- Scoring layer: the health score itself — rule-based, AI-based, or both.
- Playbook layer: the automated workflows that fire from score changes — email sequences, CRM tasks, in-app nudges, Slack alerts. This is where most teams stall: the score exists, but the actions are still manual.
- Review layer: the monthly process that compares the score to reality and adjusts.
Most companies build the signal layer manually with Zapier, a homegrown scoring model in a BI tool, and workflow execution scattered across HubSpot, Customer.io, and Slack. It works, until it doesn't — usually when the team that set it up moves on or when the data model changes.
Get an AI customer health score running this afternoon
We built CustomerScore.io so you don't have to stitch this together yourself. Connect your billing provider (Stripe or Chargebee), your product analytics (Mixpanel, PostHog, or Segment), and optionally your CRM and support stack (HubSpot, Salesforce, Intercom, Freshdesk) — and AI Health Scoring starts running on your customer base the same day.
Here's what you get out of the box:
- A 1–5 health score for every customer, updated daily — 1 means healthy, 5 means high churn risk. No rules to write, no weights to tune.
- Three specific risk drivers and three health drivers per account — so you know why a customer is at risk ("usage dropped 60% in the last 30 days," "never completed onboarding milestone 3"), not just that they are.
- Natural-language explanations for every score, ready to paste into a CSM handoff or exec update.
- Playbooks that fire automatically when a score changes — personalized emails, CRM tasks, Slack alerts, in-app nudges. The AI does the monitoring; the automation does the execution.
- Scores pushed into the tools your team already uses — HubSpot, Salesforce, Intercom, or any destination via webhook and API. No extra dashboard to check.
Setup is 30 minutes. No engineering ticket. No CSM team required. If you have ~2 months of customer data and a billing provider connected, you have enough to start — the model calibrates against your actual churn history and gets sharper from there.
If your health score today is a spreadsheet someone built once, a Mixpanel dashboard nobody opens, or a Notion page with "TODO: finish scoring model" on it — start your free CustomerScore.io trial and have AI Health Scoring live on your customers before end of day.
Frequently asked questions
What is a good customer health score?
A "good" customer health score is one that predicts churn with enough lead time to intervene — typically 30+ days before the churn event, which matches the window in which 70–80% of churning customers show warning signs. The absolute value of the score matters less than whether customers at the "healthy" end renew at a significantly higher rate than customers at the "at-risk" end. If that gap isn't there, the score isn't working regardless of what it outputs.
How do I build a customer health score?
Start with three to five signals that matter most for your product — engagement trend vs. baseline, activation milestone completion, billing cadence changes, and time-to-renewal cover the majority of B2B SaaS use cases. Assign weights based on how strongly each signal correlates with actual past churn in your customer base. Calibrate against your last 6 months of churned accounts — your score should flag ≥70% of them 30+ days before they canceled. Tie score changes to automated workflows (emails, CRM tasks, alerts). Review monthly.
Why do our customer health scores keep producing false positives?
Three common causes: (1) thresholds are global instead of per-segment — a login threshold that works for your enterprise tier is nonsense for your self-serve tier; (2) the score doesn't compare customers to their own baseline, so naturally low-usage customers always look at-risk; (3) the model weights signals that correlate with usage but not with churn (DAU is the classic example). AI-based scoring typically produces fewer false positives because it learns the actual patterns that precede churn rather than relying on predefined thresholds.
How do I connect product usage data to customer health scores automatically?
If you're building your own scoring model, you'll need to pipe events from your product analytics tool (Mixpanel, PostHog, Segment, Amplitude) into your scoring layer on a daily or real-time basis. The common path is: product analytics tool → warehouse or API → scoring model → output into CRM or alerting. Building this pipeline from scratch typically takes 1–3 months of engineering work. Tools like CustomerScore.io connect to these sources natively and run the scoring without a data pipeline project.
Can I use AI customer health scoring alongside a manual health score?
Yes, and most mature teams do. The manual score reflects your domain knowledge and explicit criteria. The AI score adds a data-driven early-warning layer on top. When they agree, confidence is high. When they disagree, the explanation is usually more informative than either score alone — often because the AI caught a pattern the manual rules hadn't been updated to include.
What's the minimum data I need to run an AI customer health score?
At minimum, ~2 months of historical data for the model to identify meaningful patterns. For the best scoring accuracy, you want at least 40–50 historical churn events so the model can learn what actually preceded a cancellation. With fewer churns, AI scoring still works by comparing active customers against the patterns of your healthiest, longest-retained accounts — scoring accuracy improves as more churn history accumulates.
What's the difference between a customer health score and a churn risk score?
In practice, very little — both are predictions of churn likelihood. "Health score" is the older framing, typically produced by a rule-based model and represented as a positive scale (higher = healthier). "Churn risk score" is often the framing for AI-based models, where the output is more directly a probability of churning in a given window. The underlying data inputs and the intended use are the same. The difference is mostly architectural and semantic.
How often should customer health scores be updated?
Daily at minimum. A health score that updates weekly misses most of the intervention window — 30%+ drops in engagement can develop and resolve in under a week. The underlying model calibration (weights in a rule-based score, deep-dive analysis in an AI score) can refresh less often — every 2 weeks is a reasonable cadence for models that learn from history.
Key takeaways
- A customer health score is only useful if it flags churn with enough lead time (30+ days) to intervene — the lead-time window is there, since 70–80% of churning customers show warning signs 30 or more days before canceling.
- The three data categories that actually predict churn are product usage trends vs. baseline, billing cadence and payment health, and contextual CRM/support data — most scores skip billing data despite it having the highest signal-to-noise ratio.
- Rule-based scoring works when your customer base is homogeneous and you have strong domain knowledge. It breaks when customers vary, when products change fast, or when you need the model to find patterns you haven't coded for.
- AI customer health scoring adapts as data changes, surfaces per-customer risk drivers, and typically reduces false positives — at the cost of needing ~2 months of history and ~40+ historical churns to start.
- The score is only half the system. Without automated playbooks firing from score changes and a monthly review layer, the score becomes a dashboard nobody looks at.
If you're running a PLG SaaS with more customers than your team can monitor one-by-one, you already know the core problem a customer health score is supposed to solve: you want to know which customers are quietly on their way out before they tell you.
Most health scoring articles stop at the definition — "aggregate product usage, support tickets, and engagement into a single number." That's the easy part. The hard part is the part nobody writes about: which signals actually predict churn, why hand-built scores keep drifting, and when it stops making sense to maintain weights manually at all.
This article covers the full picture — what a customer health score is, which data inputs genuinely move the needle, the two architectures for building one (rule-based vs. AI), and how to use the score for something other than a dashboard no one looks at.
What is a customer health score?
A customer health score is a single metric — usually a number, letter, or color — that summarizes how likely a customer is to renew, expand, or churn based on the signals they're sending through your product, billing, and support systems. It sits in the same family of scoring tools as the customer scoring matrix, but where the matrix is a 2×2 snapshot of fit and engagement, a health score is a dynamic metric that changes daily based on behavior.
A health score is not a CSAT survey. It's not an NPS. It's a composite of behavioral data — did they log in this week, are they using the features they signed up for, are their invoices paying on time, are they opening support tickets about workflows they used to understand — rolled up into one value that your team can sort, filter, and act on.
The goal is simple: catch the churn signal while you can still do something about it.
The rest of the article is about the things that determine whether your score is actually good at that job, or just a number on a dashboard.
Why most customer health scores don't work
Here's what we see over and over when teams show us the health score they built themselves — usually in a spreadsheet, Mixpanel dashboard, or a homegrown layer on top of HubSpot:
The weights were set once and never recalibrated. Someone picked "logins per week" as 30% of the score in 2024. In 2026 your product has a completely different activation pattern — maybe the API replaced the UI for power users, or a new feature shifted engagement to weekly cadence. The score is now measuring something that used to matter.
The signals are vanity, not predictive. Tracking "daily active users" feels rigorous. But DAUs don't predict churn in most SaaS products — what predicts churn is the trend of engagement relative to a customer's own baseline. A customer who went from daily to weekly logins in month three is churning; a customer who's always been weekly is fine. Flat DAU tracking can't tell them apart.
The score produces false positives. This is one of the most common searches we see around health scoring — "why do our customer health scores keep producing false positives?" Usually it's because the model flags every customer whose usage dipped below a rule threshold, without considering whether that dip is normal for their segment, lifecycle stage, or billing cycle.
Nobody uses it. The score sits in a Looker dashboard. Nobody reviews it in Monday standups. When a customer does churn, the post-mortem rarely references what the score said two weeks before.
The underlying problem: a customer health score is only useful if it changes what your team does. If the score is accurate but no workflow fires from it, it's just data. If a workflow fires from it but the score is noisy, you're annoying customers with reactive outreach. Both patterns are why most health scoring projects get abandoned within a year.
What the data says about churn signals
Before we get into how to build a better score, here's the evidence base for what to look for. These numbers come from transactional benchmark data across B2B SaaS (Baremetrics, Recurly, ChartMogul) — not survey data.
- 70–80% of customers who churn show clear warning signs 30 or more days before they cancel. The most common signal is a 30%+ month-over-month drop in login frequency or feature engagement.
- 97% of churning customers never contact support before canceling. Silent churn is the default, not the exception. Waiting for tickets means waiting until after the decision.
- 40–60% of SaaS cancellations happen within the first 90 days. If your scoring model gives equal weight to every customer regardless of tenure, it will miss most of its prediction target — because most churn is happening in a window where most signals haven't stabilized yet.
- Customers who switch from annual to monthly billing are themselves a leading churn indicator. Billing pattern changes are one of the highest-signal, lowest-latency data points available — and most health scores ignore them because they live in Stripe or Chargebee, not in the product analytics tool.
- 86% of customers are more likely to stay when onboarding is clear. Which means onboarding friction is both a churn driver and a signal: customers who don't complete core setup milestones are telling you something.
- Healthy monthly revenue churn for SMB B2B SaaS sits at 3–7% annual. If your health score is flagging 30% of your accounts as at-risk, the score is calibrated wrong — you're producing noise your team will learn to ignore.
These five numbers are the kind of thing most health scoring guides don't include. They're also the reason rule-based scoring hits a ceiling: the signals that matter (trend vs. baseline, billing pattern shifts, onboarding completion by cohort) are hard to capture in a weighted sum of thresholds. For a deeper look at how these signals translate into churn prediction, see our guide on how to spot churn risk before it's too late.
The data inputs that actually predict churn
A strong customer health score combines three categories of data. If you're missing one of them, you're scoring partial reality.
1. Product usage (required)
This is where the earliest churn signals live. Not absolute usage — trend usage.
- Engagement trend vs. baseline. A customer's usage compared to their own 30- and 90-day rolling average. This catches the "went from daily to weekly" pattern that flat metrics miss.
- Feature adoption breadth. How many of the core features for their plan tier are they actually using? Customers on 2 of 10 core features at month 6 churn at measurably higher rates than those on 6 of 10.
- Activation milestones completed. Especially in the first 30–90 days. An account that never completes onboarding is functionally pre-churned.
- Power user density. Number of active seats vs. paid seats. Shadow seats (paid but unused) are expansion and churn indicators simultaneously.
Connect your product analytics — Mixpanel, PostHog, Amplitude, or Segment — to the scoring layer. If your product is analytics-dark, this data needs to come from the database or event streams directly. Our guide on retention metrics PLG SaaS should look at covers which usage metrics correlate most strongly with retention in product-led companies.
2. Billing data (required)
Billing is the most under-used data source in most health scores, and the one with the highest signal-to-noise ratio.
- Billing cadence changes. Annual-to-monthly downgrades are a churn leading indicator. Monthly-to-annual upgrades are an expansion leading indicator.
- Payment health. Failed payments, retries, dunning states. Soft declines (insufficient funds, temporary holds) are roughly 60–70% of all payment failures and are retryable — but they also correlate with engagement drops.
- Plan changes and seat changes. Downgrades and seat reductions are often the last signal before cancellation.
- Renewal proximity. Accounts within 60 days of renewal need different weighting than accounts 8 months out. Time-to-renewal should be a dimension of the score, not a filter applied after. Net Revenue Retention is the board-level metric this ultimately rolls up to — see our NRR guide for how health scoring feeds into retention reporting.
Stripe and Chargebee are the two most common sources. Even billing data alone — without product usage — gives you a usable signal set.
3. CRM and support data (optional, useful)
This is the context layer. On its own, it's weak. Combined with usage and billing, it resolves ambiguous cases.
- Support ticket sentiment and volume trend. Rising ticket volume can signal friction; falling volume can signal disengagement — which interpretation matters depends on the rest of the score.
- CSM activity history. When was the last meaningful touch? Did the account have an owner change recently?
- Relationship data. Champions leaving (detectable through CRM contact changes) is a strong churn predictor at mid-market and up.
HubSpot, Salesforce, Intercom, and Freshdesk are the usual sources.
The combination matters more than any single input. A customer whose support tickets are rising and whose usage is flat and whose billing just went annual→monthly is a fundamentally different risk profile than a customer with only one of those signals. Rule-based scores can handle this with enough if/then logic. AI scores handle it natively — which brings us to the architecture question.
Rule-based vs. AI customer health scoring
There are two ways to build a customer health score. Both work, and they're not mutually exclusive — most mature teams end up running both. But they solve different problems and they fail in different ways.
Rule-based (manual) customer health scoring
You define the signals that matter. You assign weights. You set thresholds. You categorize customers by score.
This is the approach every health scoring article you've read describes. It's also what most CS platforms (Gainsight, Totango, ChurnZero) support natively — you build a scoring model inside their UI, they execute it.
Where it works:
- Your customer base is homogeneous — similar segments, similar lifecycle, similar usage patterns
- You have strong domain knowledge about what drives churn in your specific product
- Your team will actively maintain and recalibrate the model (quarterly minimum)
- You need full transparency into why a score is what it is
Where it breaks:
- You have heterogeneous customers (multiple segments, products, billing models) — the weights that work for one segment actively mislead on another
- Your product changes faster than you can recalibrate the model
- You don't know upfront what drives churn and need the model to surface patterns you haven't seen yet
- You're drowning in false positives because thresholds are brittle ("below 10 logins per week = at risk" is true for some plans, nonsense for others)
AI customer health scoring
The model learns from your actual data — which customers churned, which signals preceded those churns, which patterns don't predict anything — and assigns scores based on what the data says matters, not what you think matters.
This is what CustomerScore.io's AI Health Scoring does. The architecture: a deep-dive analysis runs per customer across all connected data sources (billing, product usage, engagement, support), and a daily scoring pass evaluates each customer against the latest data. Each customer gets a 1–5 score (1 = healthy, 5 = high churn risk), up to three specific risk drivers, up to three health drivers, and a natural-language explanation of what's moving the score.
Where it works:
- You have at least 2 months of historical data and 40+ historical churn events for the model to learn from
- Your customer base is varied enough that rule-based scoring produces noisy results
- You want the score to adapt as your product and customer base evolve, without someone tuning it
- You want per-customer explainability ("their score is 4 because feature X usage dropped 60% in the last 30 days") instead of rule attribution ("score is low because rules 3, 7, and 12 triggered")
Where it breaks:
- You have fewer than ~100 active customers or very few historical churns — not enough data for the model to find patterns
- You need the scoring logic to be hand-auditable for regulatory reasons (financial services, healthcare)
- You want to explicitly override what the model thinks matters because you know something the data doesn't show
| Manual / Rule-Based Scoring | AI Customer Health Scoring | |
|---|---|---|
| Setup | You define metrics, weights, and thresholds | Automatic — the model learns from your data |
| Maintenance | Requires regular recalibration as your business evolves | Auto-adjusts as new data comes in |
| Explainability | Shows which rules triggered | Shows specific per-customer drivers and brakes |
| Adaptability | Doesn't adapt to new patterns, segments, or seasonal changes | Continuously learns from changing data |
| Prerequisite knowledge | You need to know upfront what drives churn | The model discovers what drives churn from your data |
| Minimum data | None — works on day one with your assumptions | ~2 months history, ~40 historical churns for best accuracy |
Most teams we work with end up running both. The rule-based score reflects domain knowledge ("we know this segment always dips in Q3 and that's not churn") and the AI score acts as an early-warning layer that catches patterns humans haven't coded for yet. The two scores disagreeing is often more informative than either one alone.
How to build a customer health score that actually gets used
Whether you go rule-based or AI, the score is only useful if it drives action. Here's the minimum workflow to make a health score operational. (For a longer, PLG-specific walkthrough, see our step-by-step guide to scoring customers in PLG SaaS.)
1. Define what the score is for
A score that tries to predict both churn and expansion at the same time does both poorly. Pick one primary use case. For most PLG teams, it's churn risk — everything else (prioritization, renewals, expansion) is downstream.
2. Pick the 3–5 signals that matter most
Not 15. Rule-based scores with 15 inputs become impossible to interpret when they're wrong. For most B2B SaaS companies, the highest-signal inputs are: engagement trend vs. baseline, activation milestone completion, billing cadence or payment health, and time-to-renewal. Everything else is refinement.
3. Calibrate against actual churn
This is the step teams skip. Pull your last 6 months of churned accounts. Run your proposed score against them. Does the score flag them ≥30 days before they churned? If no, your weights are wrong or your signals don't include the ones that actually predicted this churn. Iterate before you go live.
4. Tie scores directly to actions
A score that doesn't fire a workflow is decoration. The minimum setup:
- Score moves from 2 to 4: Trigger a personalized check-in email sequence and create a task in your CRM for the account owner
- Score hits 5: Escalate to a human — Slack alert, CSM task, or founder notification depending on deal size
- Score improves from 4 to 2: Log the change, note what preceded it — this is your win playbook source material
- Every account with score 4+ for more than 14 days: Create a win-back or save play
5. Review the score against reality, monthly
Every month, take the top 20 accounts the score flagged and the top 20 it didn't. Compare against what actually happened. If the score missed a churn or flagged a healthy customer as at-risk, figure out which signal broke — and either retrain (AI) or recalibrate (rules).
How customer health scoring fits into a retention system
The score itself is the diagnostic layer. It tells you who to worry about. You still need the other three layers to close the loop:
- Signal layer: clean, connected data across product analytics, billing, CRM, and support. Without this, no score is reliable.
- Scoring layer: the health score itself — rule-based, AI-based, or both.
- Playbook layer: the automated workflows that fire from score changes — email sequences, CRM tasks, in-app nudges, Slack alerts. This is where most teams stall: the score exists, but the actions are still manual.
- Review layer: the monthly process that compares the score to reality and adjusts.
Most companies build the signal layer manually with Zapier, a homegrown scoring model in a BI tool, and workflow execution scattered across HubSpot, Customer.io, and Slack. It works, until it doesn't — usually when the team that set it up moves on or when the data model changes.
The alternative is a retention system that handles all four layers natively. CustomerScore.io connects to Mixpanel, PostHog, Segment, Stripe, Chargebee, HubSpot, Salesforce, and Intercom out of the box, runs AI Health Scoring on the combined dataset, and fires playbooks automatically when a score changes. Setup is 30 minutes. You don't need a CSM team to operate it — the AI handles the monitoring and the automation handles the execution.
If your health score today is a dashboard someone built once and doesn't look at anymore, see how AI Health Scoring works in CustomerScore.io.
Frequently asked questions
What is a good customer health score?
A "good" customer health score is one that predicts churn with enough lead time to intervene — typically 30+ days before the churn event, which matches the window in which 70–80% of churning customers show warning signs. The absolute value of the score matters less than whether customers at the "healthy" end renew at a significantly higher rate than customers at the "at-risk" end. If that gap isn't there, the score isn't working regardless of what it outputs.
How do I build a customer health score?
Start with three to five signals that matter most for your product — engagement trend vs. baseline, activation milestone completion, billing cadence changes, and time-to-renewal cover the majority of B2B SaaS use cases. Assign weights based on how strongly each signal correlates with actual past churn in your customer base. Calibrate against your last 6 months of churned accounts — your score should flag ≥70% of them 30+ days before they canceled. Tie score changes to automated workflows (emails, CRM tasks, alerts). Review monthly.
Why do our customer health scores keep producing false positives?
Three common causes: (1) thresholds are global instead of per-segment — a login threshold that works for your enterprise tier is nonsense for your self-serve tier; (2) the score doesn't compare customers to their own baseline, so naturally low-usage customers always look at-risk; (3) the model weights signals that correlate with usage but not with churn (DAU is the classic example). AI-based scoring typically produces fewer false positives because it learns the actual patterns that precede churn rather than relying on predefined thresholds.
How do I connect product usage data to customer health scores automatically?
If you're building your own scoring model, you'll need to pipe events from your product analytics tool (Mixpanel, PostHog, Segment, Amplitude) into your scoring layer on a daily or real-time basis. The common path is: product analytics tool → warehouse or API → scoring model → output into CRM or alerting. Building this pipeline from scratch typically takes 1–3 months of engineering work. Tools like CustomerScore.io connect to these sources natively and run the scoring without a data pipeline project.
Can I use AI customer health scoring alongside a manual health score?
Yes, and most mature teams do. The manual score reflects your domain knowledge and explicit criteria. The AI score adds a data-driven early-warning layer on top. When they agree, confidence is high. When they disagree, the explanation is usually more informative than either score alone — often because the AI caught a pattern the manual rules hadn't been updated to include.
What's the minimum data I need to run an AI customer health score?
At minimum, ~2 months of historical data for the model to identify meaningful patterns. For the best scoring accuracy, you want at least 40–50 historical churn events so the model can learn what actually preceded a cancellation. With fewer churns, AI scoring still works by comparing active customers against the patterns of your healthiest, longest-retained accounts — scoring accuracy improves as more churn history accumulates.
What's the difference between a customer health score and a churn risk score?
In practice, very little — both are predictions of churn likelihood. "Health score" is the older framing, typically produced by a rule-based model and represented as a positive scale (higher = healthier). "Churn risk score" is often the framing for AI-based models, where the output is more directly a probability of churning in a given window. The underlying data inputs and the intended use are the same. The difference is mostly architectural and semantic.
How often should customer health scores be updated?
Daily at minimum. A health score that updates weekly misses most of the intervention window — 30%+ drops in engagement can develop and resolve in under a week. The underlying model calibration (weights in a rule-based score, deep-dive analysis in an AI score) can refresh less often — every 2 weeks is a reasonable cadence for models that learn from history.
Key takeaways
- A customer health score is only useful if it flags churn with enough lead time (30+ days) to intervene — the lead-time window is there, since 70–80% of churning customers show warning signs 30 or more days before canceling.
- The three data categories that actually predict churn are product usage trends vs. baseline, billing cadence and payment health, and contextual CRM/support data — most scores skip billing data despite it having the highest signal-to-noise ratio.
- Rule-based scoring works when your customer base is homogeneous and you have strong domain knowledge. It breaks when customers vary, when products change fast, or when you need the model to find patterns you haven't coded for.
- AI customer health scoring adapts as data changes, surfaces per-customer risk drivers, and typically reduces false positives — at the cost of needing ~2 months of history and ~40+ historical churns to start.
- The score is only half the system. Without automated playbooks firing from score changes and a monthly review layer, the score becomes a dashboard nobody looks at.