How to Build SaaS Customer Health Scores: A Step-by-Step Framework
If you’re not scoring your customers, you’re leaving revenue on the table. By properly scoring your user base, you can improve retention, grow your expansions, and convert more trials to paid users.
In Product-Led Growth (PLG) SaaS, customer scoring is essential because it prioritizes resources and flags shifts in your user base.
The Scoring Matrix: Your Crystal Ball to Customer Health
A well-designed scoring matrix reveals customer needs and guides your next steps in better monetizing your user base. Single‑axis scoring misses vital context and does not drive your focus. That is why we add 2nd scale, which helps you focus your energy, where it makes the most impact.
So the good old 2 by 2 is the way to go. You have to combine the Engagement of your users (app usage) with the fit score (ICP alignment). Let’s dive into these 2 to explain them better.
Engagement score - How active they are
The engagement score tells you how engaged your customers are. Generally, how much value are they getting from your product?
How to find the right engagement metrics?
There are several areas where you should look. You might already be tracking these separately somewhere, so you just need to pull them together.
We recommend looking at your North Star metric and working backwards from there. Pick the metrics that are the most influential drivers of your north star. Customer-facing teams are also a great resource here you need to utilise, especially your customer success managers. They will intuitively know from customer interactions what makes them tick and what triggers them.
Single, crucial metric that best captures the core value your product delivers to customers. It serves as a guiding light for your company’s growth strategy, aligning teams across departments toward a common goal.
- Product Usage Volume: How much is the account using your product? For example, a project management SaaS might track the number of tasks or projects an account creates.
- Usage Frequency & Velocity: How often do they use your product? For most companies, this is usually the login frequency. The absolute number here will tell more about your product, but trends over time are what you want to look for here. Whether the frequency is dropping or growing will tell you a lot.
- Breadth of Feature Adoption: Simply said, how many features of your product are they using? The key here is to know which features promote stickiness and adoption and focus on these. Bringing in marginal features that are nice to have in the product makes no sense.
- Payment behavior: Are they missing payments or constantly upgrading their limits? Did they pause their subscription 3 times in the last 6 months? Payment beha
- Late payments or consistent upgrades?
- Customer support sentiment: When your customer hits your support 3 times a week, there might be a problem, right? Frequency is important, but you also have to look at the sentiment. When your CC team can resolve these queries and the customer is happy again, there might not be a problem.
- Key Activation Actions: This is the “aha moment” of your app. These should be heavily weighted, especially when looking at trial accounts. A great example here is Slack’s famous PQL example (a team sending 2,000 messages).
- Outside the product engagement: Product usage is key for PLG SaaS, but in some cases, it is a good idea to complement this with other things. Email engagement, webinar attendance, visits to pricing or FAQ pages, and responsiveness to customer success outreach are good candidates here. I heard a really good case recently when 1 customer wanted to track visits to the page terms of cancelation, which might strongly indicate the user is looking to churn.
- Satisfaction Metrics: We strongly believe that what customers do says more about them than what they tell you in simple surveys. But you should definitely not discard NPS (Net Promoter Score), CSAT, or customer support satisfaction, as they can definitely give you a helping hand here.
Fit score - Are they the right customer?
So why is engagement score alone not enough? Because when you have hundreds or even thousands of customers, you need to focus. Trying to save everybody is like marketing to everybody - you will spread yourself too thin and end up wasting your resources and energy on people who were not right for your product in the first place.
Your Fit score should be based on your ICP. It basically tells you how well the customer aligns with your ICP.
You can look at customer information such as:
- Company size: Does their team size match your ICP?
- Industry: Are they in your target verticals?
- Geography: Certain regions might be more profitable for your business.
- Website traffic: Are they growing or stagnant?
- Tech stack: Do they use complementary tools that integrate with your product?
- Revenue potential: Are they capable of upgrading to a higher plan?
How do I get all of this data into 1 place?
Start small and then scale up as you see value. Don’t overthink your scoring. It is always better to have a scoring model fast than to have no scoring model, because you cannot create the perfect one. You can start with only a handful of the most important metrics to get first results, then you improve the model iteratively.
For your Fit score, pick a few metrics that describe your ICP, like we mentioned above. For the engagement score, we believe that looking at your North Star metric is the best way to start.
Example of a Live chat platform:
Let’s say you are a live chat support tool. If you are at the beginning of your scoring journey, you could take a handful of your most important metrics, like:
- Number of conversations or tickets solved in the last 30 days
- Last login date
- Number of hours spent in the app per month
- AI compose usage - how much the account is using your AI features.
- % of conversations resolved by automation
You probably already have the data somewhere in your tech stack. We believe the most valuable data is found in these tools:
- Billing data (Stripe, Chargebee) - so you financial data for every account and know who churns.
- Customer data: (Hubspot, Salesforce) - this is the place where the data for the Fit score is
- Engagement data (Posthog, Mixpanel, Amplitude)
- Customer Support tools (Intercom, Freshdesk) - when someone is pissed the data is usually here 🙂
We have done the heavy lifting for you!
Customerscore.io integrates with all of the major tools mentioned above, so you can start scoring your customers in no time.
Calculate your scoring matrix
So now you know, or at least have a rough idea of what to track. So, how do we take all this data and create the engagement and fit score for each account? We need to do a little math, but don’t worry - it is no rocket science and you can create a static, easy scoring model in Google Sheets yourself.
Step 1: Assign Scores to Each Parameter
Here we need to tell the scoring model what values are good for us and which are bad. We normalize the numbers and other parameters. Don’t worry, it is easier than you think. What you effectively do is convert every metric or parameter to a simple score that goes from -100 to +100.
I will show you how to do this for different formats and give examples so it is easier to understand.
- Number metrics: Here, you set 3 values for each metric - minimum, middle, and maximum. You basically tell the scoring model which value of the metric is great (maximum), somewhat okay (middle), and very poor (minimum).Let’s say you care about the website traffic of your customers. You set minimum at 1k traffic, mid at 5k, and maximum at 50k. If the customer has 1k traffic or less, he will get a score of -100, if he has 5k, he will get a score of 0, and if he has 50k or more, he will get a score of 100.
- List of values: Here, you assign a score from -100 to +100 for each value on the list.Let’s take countries as an example. You have a list of countries, and you go through them and give each country a score. So you will give +100 to the US because that is where your best customers are, and give -100 to Belarus, because you get really bad leads from there. You do this for every country. You can make your life easier here by grouping them into continents or economic areas.
- True or false values: Here you go, and assign a score if true or false.Say you care a lot if the user integrates your tool with Hubspot. He is either integrated or not. So let’s say you give 100 score points to the customer that integrated with Hubspot (true) and give 0 score points if they did not (false).
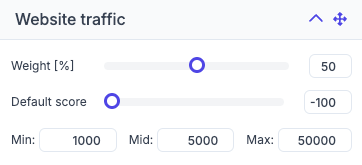
Missing data? Your data might not be perfect, they rarely are, so it is also good to think about what score you assign when the value is missing. We call this the default score. So, if you don’t know what the website traffic of a particular customer is, we assign them some default score.
Step 2: Prioritize what matters
Give each parameter a weight on a scale of 0% to 100%. You tell the scoring model how important each metric is for you. Parameters with higher weight have a bigger impact on the final score.
- For example:
- Website traffic may have a weight of 50% for the Fit Score.
- Days since last login may have a weight of 25% for the Engagement Score.
Step 3: Calculate the Weighted Scores
Here, you simply go and multiply the score by its weight for each parameter.
- Example:
- A company’s website traffic has a score of +80 with a weight of 50%.
- Weighted score = 80 × 0.5 = 40.
Repeat this for all parameters within the Fit and Engagement categories.
Step 4: Combine the Weighted Scores
- Fit score: You sum all the weighted scores for Fit parameters to get the final fit score for each account
- Engagement score: You sum all the weighted scores for Engagement parameters to get the final engagement score for each account
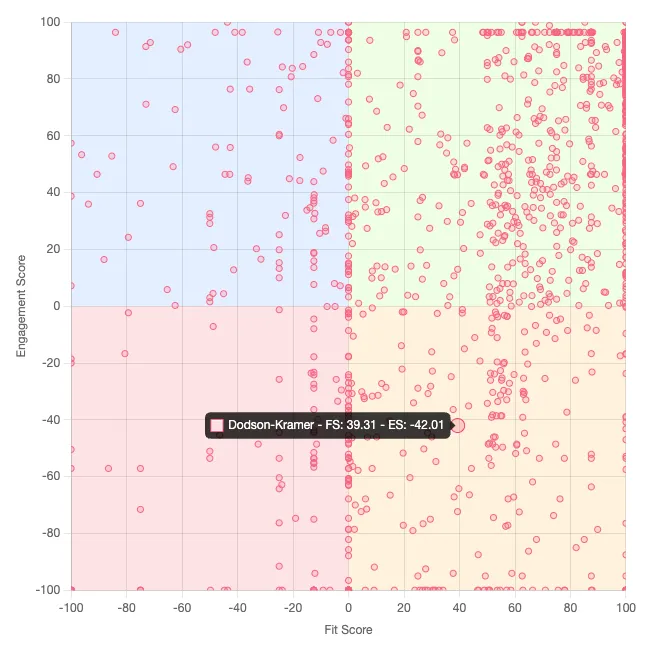
Step 5: Create the Matrix
Now you can plot your results into a chart and have a bird’s eye view of your whole customer base. Just one look and you can see how healthy your user base is. How much churn risk is there, and what is the lowest-hanging fruit for you. This chart is also a great resource for tweaking the scoring model.
The X axis represents the FIT score:
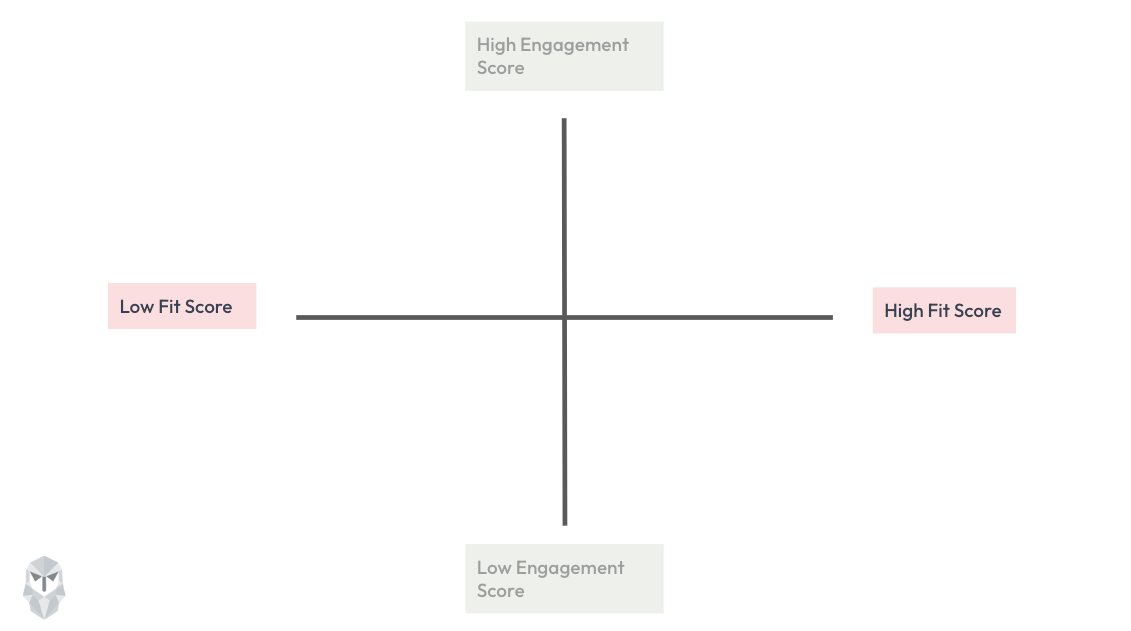
The X axis shows the Engagement score.
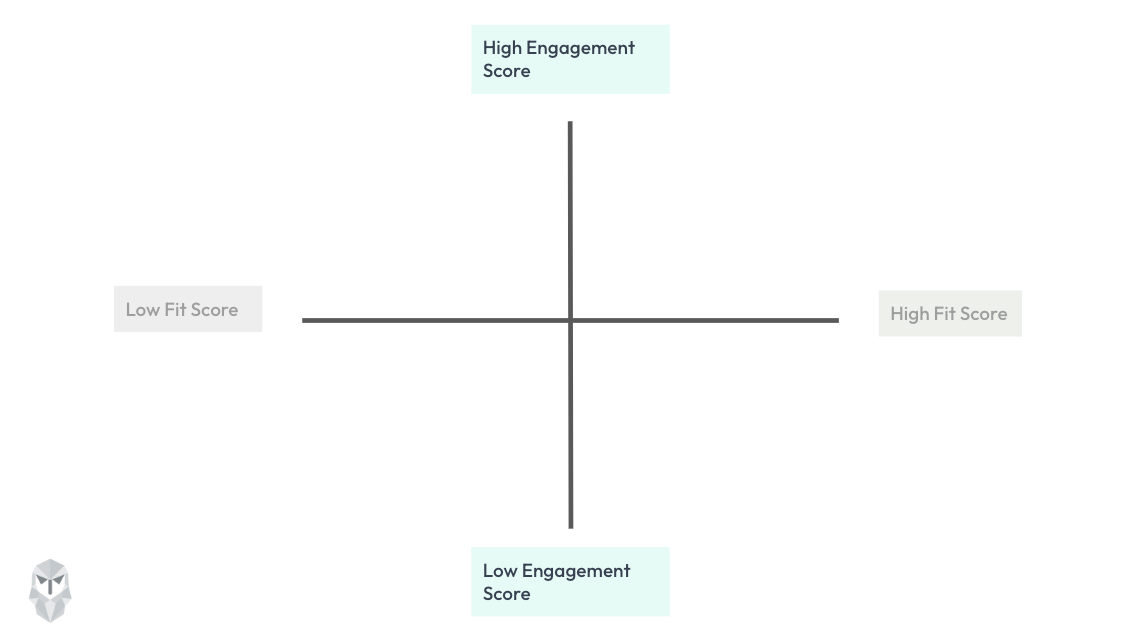
You will end up with a chart, where each dot represents 1 customer. The scoring matrix inside Customerscore.io looks something like this:
How to work with the Matrix?
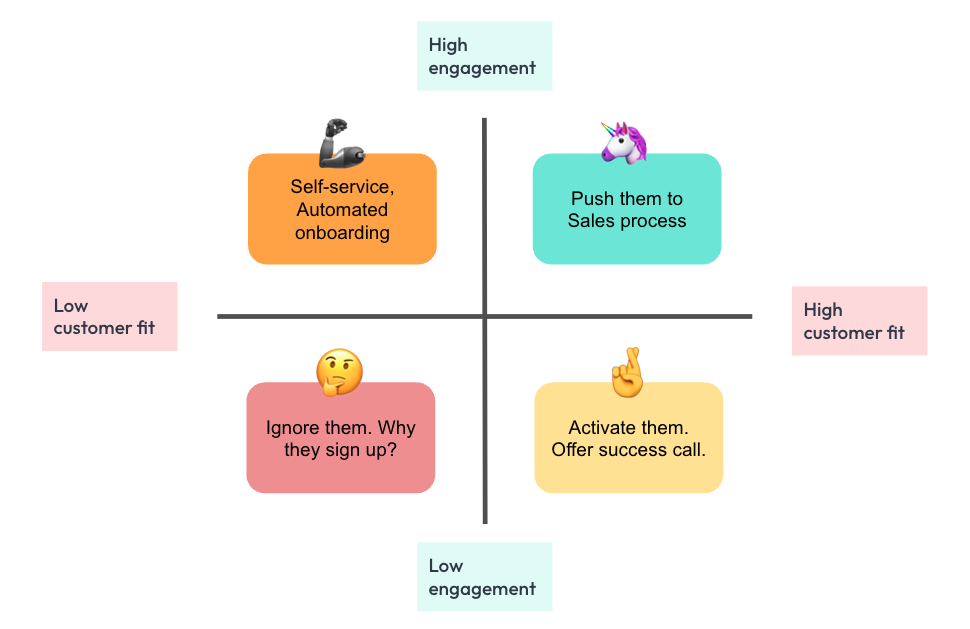
Your 2×2 matrix of Engagement (Y‑axis) vs. Fit (X‑axis) reveals four strategic quadrants. Here’s how to interpret and act on each:
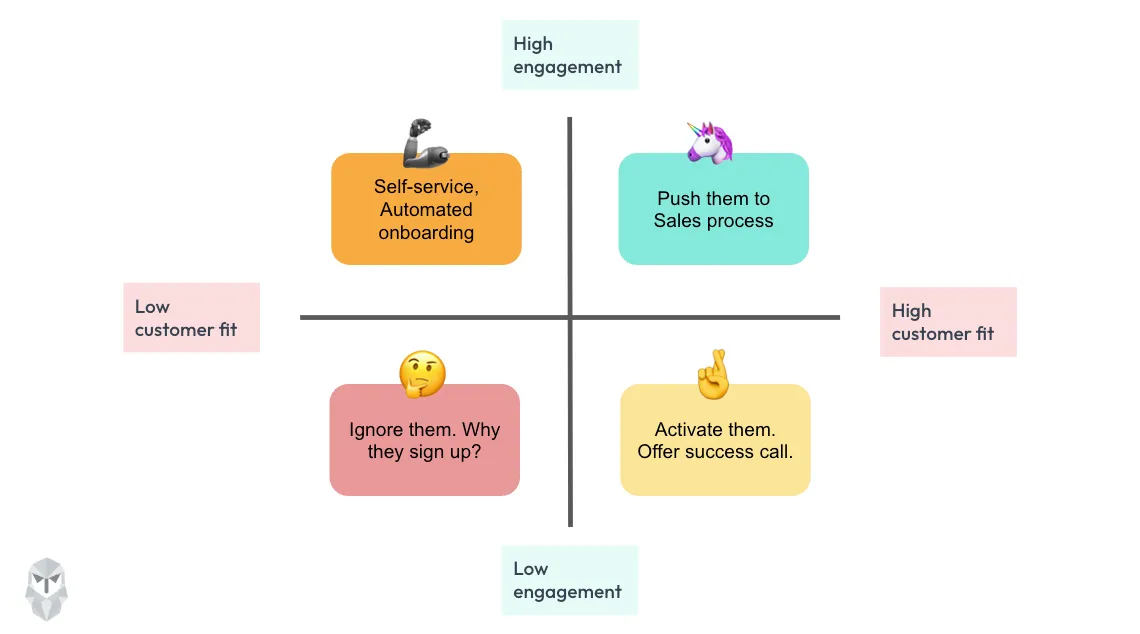
1. High Fit & High Engagement (“Unicorns”)
- Who they are: Your ideal customers who are already power users.
- Strategy: Move quickly to sales or expansion plays—offer white‑glove demos, executive reviews, and tailored upsell offers.
- Example use case: A 50‑seat trial team sending 2,000 messages/week hits PQL thresholds—trigger a direct outreach from Sales.
2. High Fit & Low Engagement (“At‑Risk Potential”)
- Who they are: Perfect ICP fit, but slow to adopt or in danger of stagnation.
- Strategy: Deploy high‑touch onboarding and reactivation campaigns—schedule personalized success calls, workshops, or product walkthroughs.
- Example use case: An enterprise prospect signs up but logs in only once—assign a CSM to run through key features and remove onboarding blockers.
3. Low Fit & High Engagement (“Self‑Serve Stars”)
- Who they are: Active power users who fall outside your core ICP (e.g., freelancers, SMBs).
- Strategy: Enable scalable support—automated guides, community forums, in‑app tooltips—while monitoring for any shift in fit.
- Example use case: A single‑user power user maxes API calls—serve an in‑app upsell prompt to a small paid plan without involving sales.
4. Low Fit & Low Engagement (“Bench Warmers”)
- Who they are: Low‑value sign‑ups or churn risks with minimal activity.
- Strategy: Minimize human intervention—automated exit or win‑back surveys and low‑touch nurture emails to capture feedback.
- Example use case: A trial user from a non‑target industry fades away—send one final “Help us improve” survey, then archive.
Static numbers are only half the truth
So, where is the rest of the wisdom hidden? You need to closely monitor how the engagement score changes. 1 snapshot of your data will tell you how it is now. By looking at how engagement score develops for each account over time, you can spot trends and react to them.
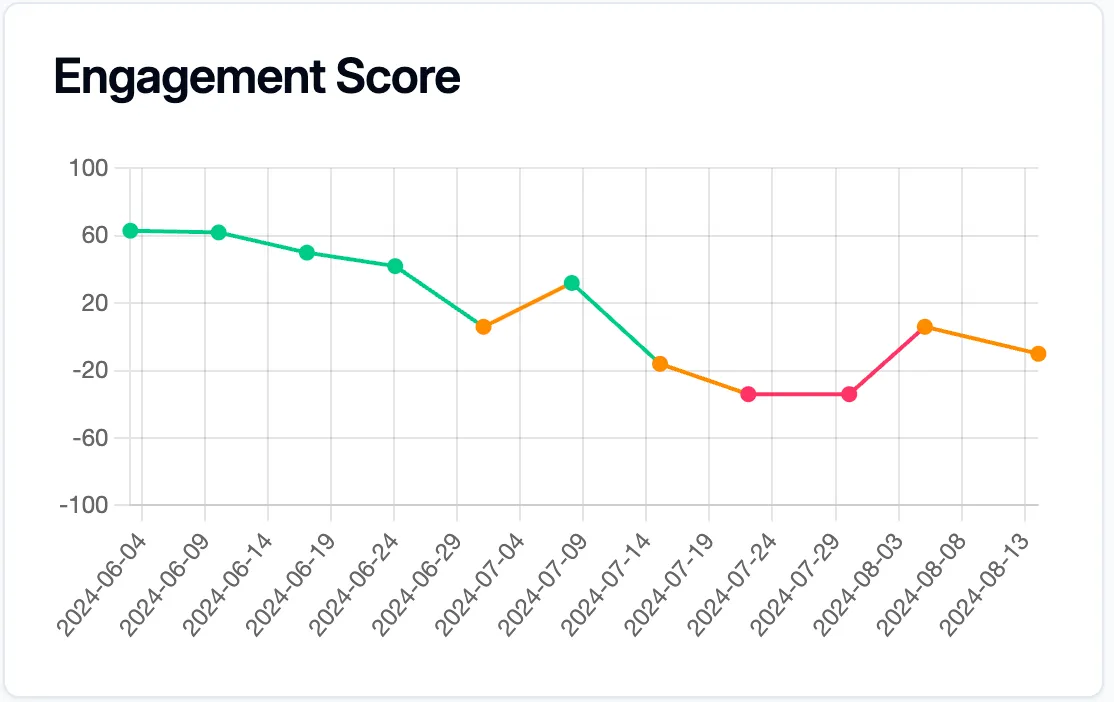
- Spot Churn before it happens - If you see the engagement score dropping significantly over the past weeks it it is a great signal that the customer might churn. Fighting churn is easier the earlier you start. When they are clicking “cancel subscription”, it might be too late.
- See hidden expansion potential - When one of your customers 3x their usage in the last quarter, they might be very ripe to expand, as they are potentially driving a lot of value from your product.
- Engage the right trial or free accounts - uncover the hidden gems inside your trial or free users and offer them something extra to push them over the edge to one of your paid plans.
Now you have to Act!
You have your scores, you monitor the trends. Now you have to unlock the hidden MRR in your user base. For a lot of PLG SaaS serving hundreds or thousands of customers, this is not an easy task. Monitoring the scores manually and sending emails one by one is unrealistic. So you need to automate!
Reminders
Your high-ticket customers deserve high touch and big care. That is why you need to know something is wrong instantly. Remember, the sooner you start addressing a problem or opportunities, the better your chances.
That’s why you want your customer success team to get instant reminders when there are negative changes in their portfolio, or let them know there is value not harvested in the user base.
Playbooks
For accounts with smaller ARPA, the ROI of doing things manually starts to diminish very quickly. So you ideally need a fully automated set-up that will that will send the right communication to the right customer at exactly the right moment.
Using the changes in engagement score is a great signal to run automated email sequences, deploy in-app notifications or banners, and save or expand your customers.
Ready to Maximize Revenue from Your Current Base?
Start using the scoring matrix to identify growth opportunities and tackle churn risks with confidence. Your most valuable customers are waiting—go find them! 🚀
If you want help with customer scoring and automating your day-to-day work with customers, try Customerscore.io.