
How to Score Customers in B2B SaaS: Step-by-step Guide
If you’re not scoring your customers, you’re leaving revenue on the table.
In Product-Led Growth (PLG) SaaS, customer scoring isn’t just a buzzword—it’s a necessity. By combining Engagement Score and Fit Score, you can prioritize customers with the highest potential for upsells, retention, or activation.
Here’s how to build a scoring matrix that works:
Engagement Score: How active are they?
The engagement score reflects how well customers are interacting with your product and brand. The more engaged they are, the higher their potential.
Here are some parameters to include:
• Feature adoption: Are they using your core features or just scratching the surface?
• Product usage: Daily, weekly, or monthly? Usage trends matter.
• Payment behavior: Late payments or consistent upgrades?
• Customer support sentiment: What’s the tone of their requests—positive or frustrated?
• Newsletter or email engagement: Are they opening and clicking, or ghosting your updates?
• Time in product: Are they still new or seasoned users?
Fit Score: Are they the right customer?
Fit score helps you understand how closely a customer aligns with your Ideal Customer Profile (ICP).
Key parameters to score fit include:
• Company size: Does their team size match your ICP?
• Industry: Are they in your target verticals?
• Geography: Certain regions might be more profitable for your business.
• Website traffic: Are they growing or stagnant?
• Tech stack: Do they use complementary tools that integrate with your product?
• Revenue potential: Are they capable of upgrading to a higher plan?
The Scoring Matrix: How to Calculate the Final Score
To effectively map your customers into the scoring matrix, you need to calculate their Fit Score and Engagement Score. Here’s how to do it step-by-step:
Step 1: Assign Scores to Each Parameter
For every parameter included in Fit or Engagement, assign a score on a scale of -100 to +100.
- -100: A highly negative indicator (e.g., very low feature usage or misaligned company size).
- +100: A highly positive indicator (e.g., daily active users or a perfect ICP match).
- 0: Neutral, where the parameter has no significant effect.
Step 2: Define the Importance of Each Parameter
Set a weight of importance for each parameter on a scale of 0 to 100%.
- Parameters with higher weights will have a larger impact on the final score.
- For example:
- Website traffic may have a weight of 50% for Fit Score.
- Days since last login may have a weight of 25% for Engagement Score.
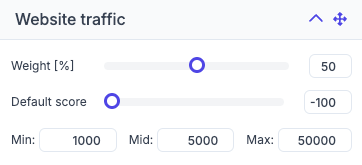
Step 3: Calculate the Weighted Scores
For each parameter, multiply the score by its weight.
- Example:
- A company’s website traffic has a score of +80 with a weight of 50%.
- Weighted score = 80 × 0.5 = 40.
Repeat this for all parameters within the Fit and Engagement categories.
Step 4: Combine the Weighted Scores
Add up all the weighted scores for Fit parameters to calculate the Fit Score.
Add up all the weighted scores for Engagement parameters to calculate the Engagement Score.
Step 5: Plot the Scores in the Matrix
- Fit Score defines the customer’s position on the X-axis.
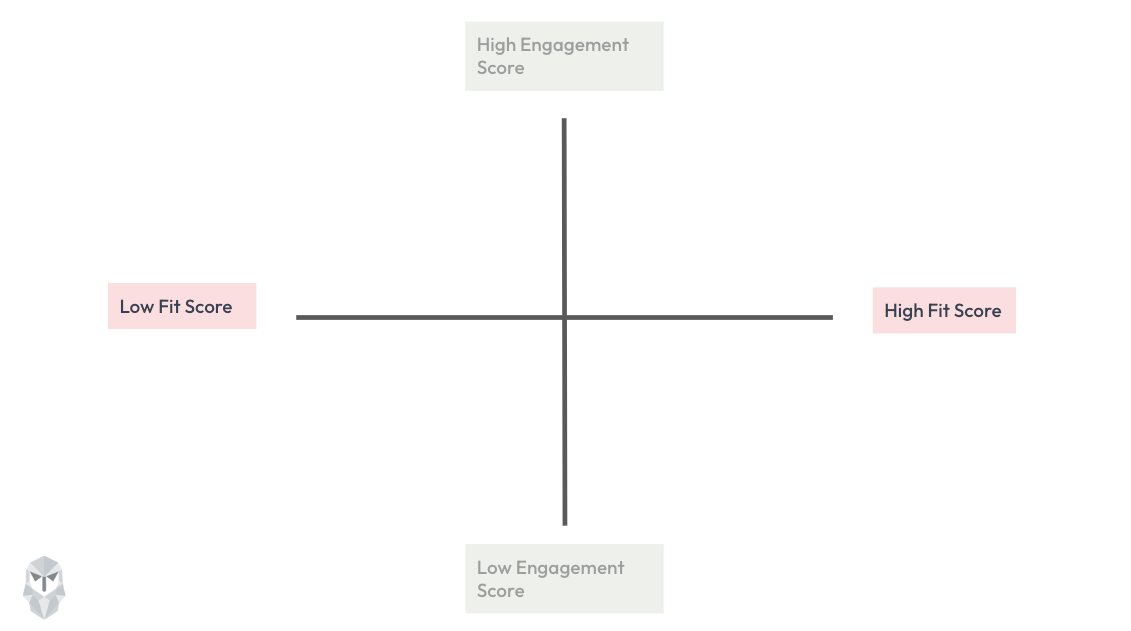
- Engagement Score defines their position on the Y-axis.
Visualizing the Quadrants
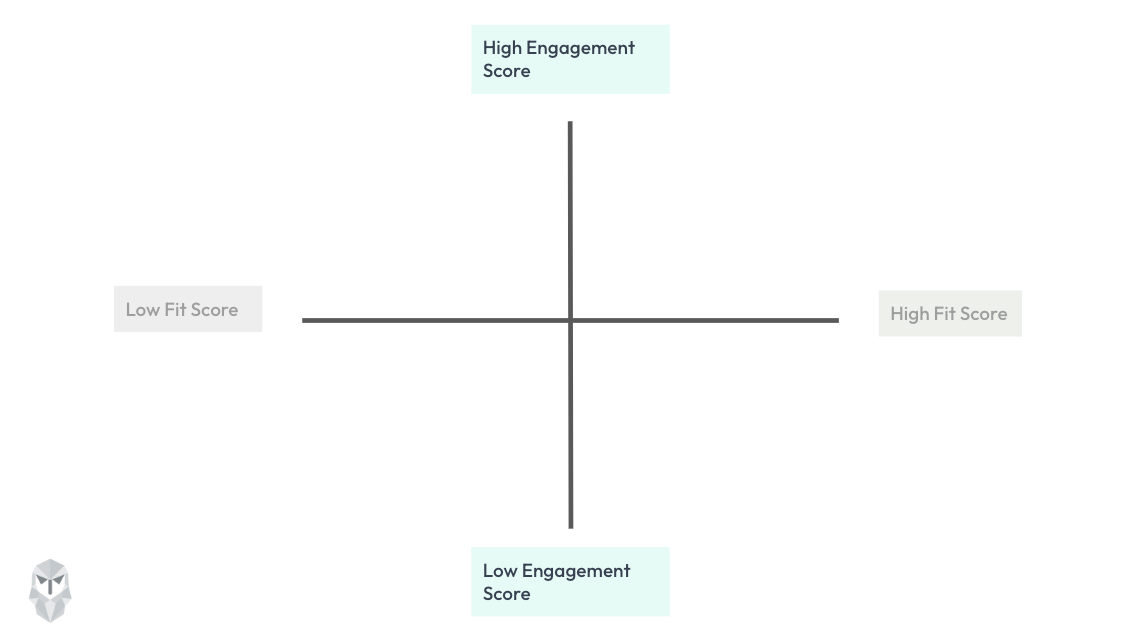
After calculating the scores, plot them on the matrix. Each dot in the matrix represents one of your customer.
This is how Scoring matrix looks like in the Customerscore.io platform after you pull your data into it.
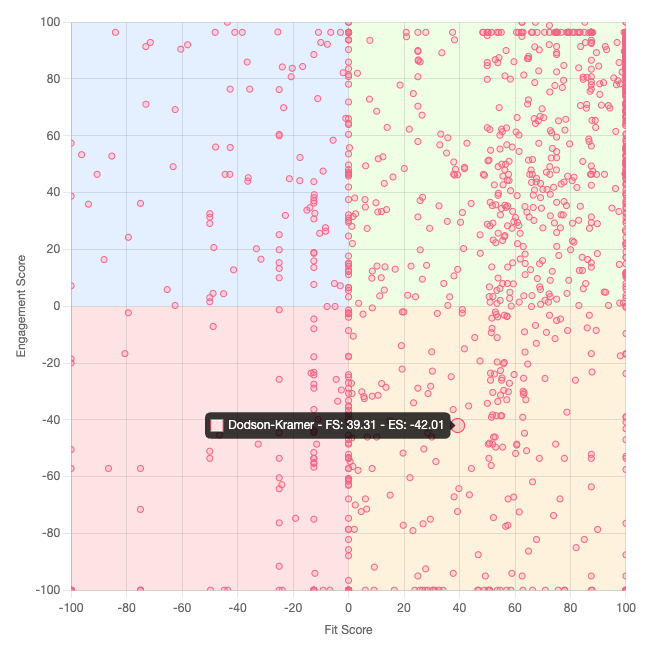
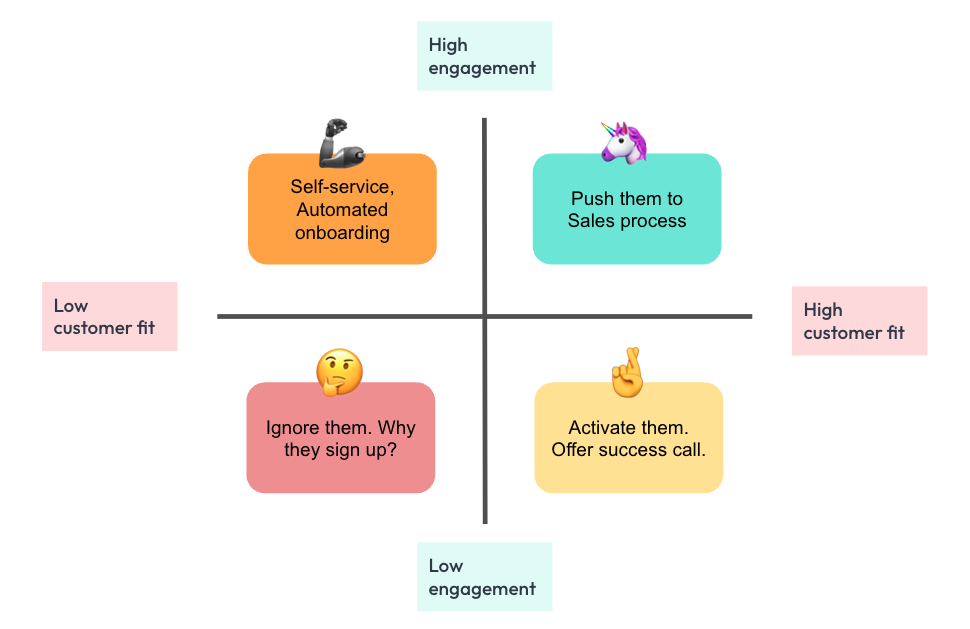
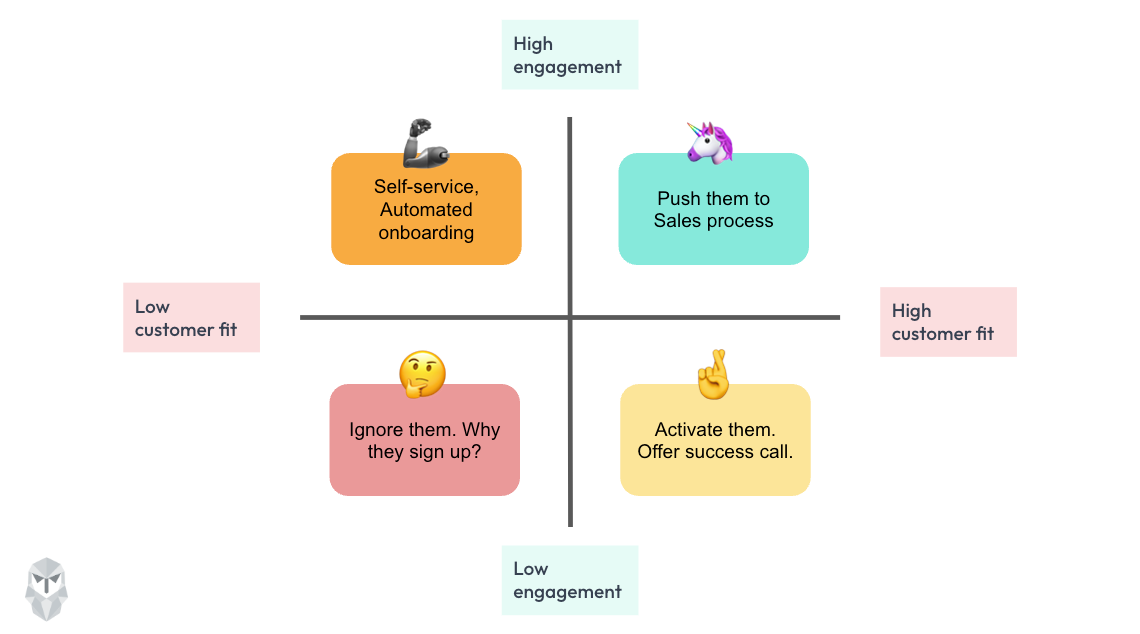
See? Not all customers deserve the same attention. Here’s how to focus on the ones that matter most.
- High Engagement + High Fit
🦄 Push them to Sales.
These are your unicorns—your perfect-fit customers who are already engaged. Don’t waste time. Convert them!
- High Engagement + Low Fit
💪 Self-service & Automated Onboarding.
They’re using your product but aren’t a perfect fit for your ICP. Let automation handle them while you focus on bigger opportunities.
- Low Engagement + High Fit
🤞 Activate them.
These are strong ICP matches who haven’t fully adopted your product yet. Offer success calls or personalized outreach to re-engage them.
- Low Engagement + Low Fit
🤔 Ignore them.
It’s harsh, but if they’re neither engaged nor a good fit, ask yourself why they signed up—and don’t overinvest.
By systematically scoring and weighting parameters, you get a clear, data-driven way to prioritize your customers and focus your efforts where they matter most.
Ready to Maximize Revenue from Your Current Base?
Start using the scoring matrix to identify growth opportunities and tackle churn risks with confidence. Your most valuable customers are waiting—go find them! 🚀
If you want help with customer scoring and automating your day-to-day work with customers, try Customerscore.io.