Customer detail
Having a detailed overview of a customer is crucial for retaining them or increasing their profitability. For this reason, you can view each customer in their detail view, which we will introduce in this article. You can easily access the customer detail view from the table of active or churned customers, and it looks like this.
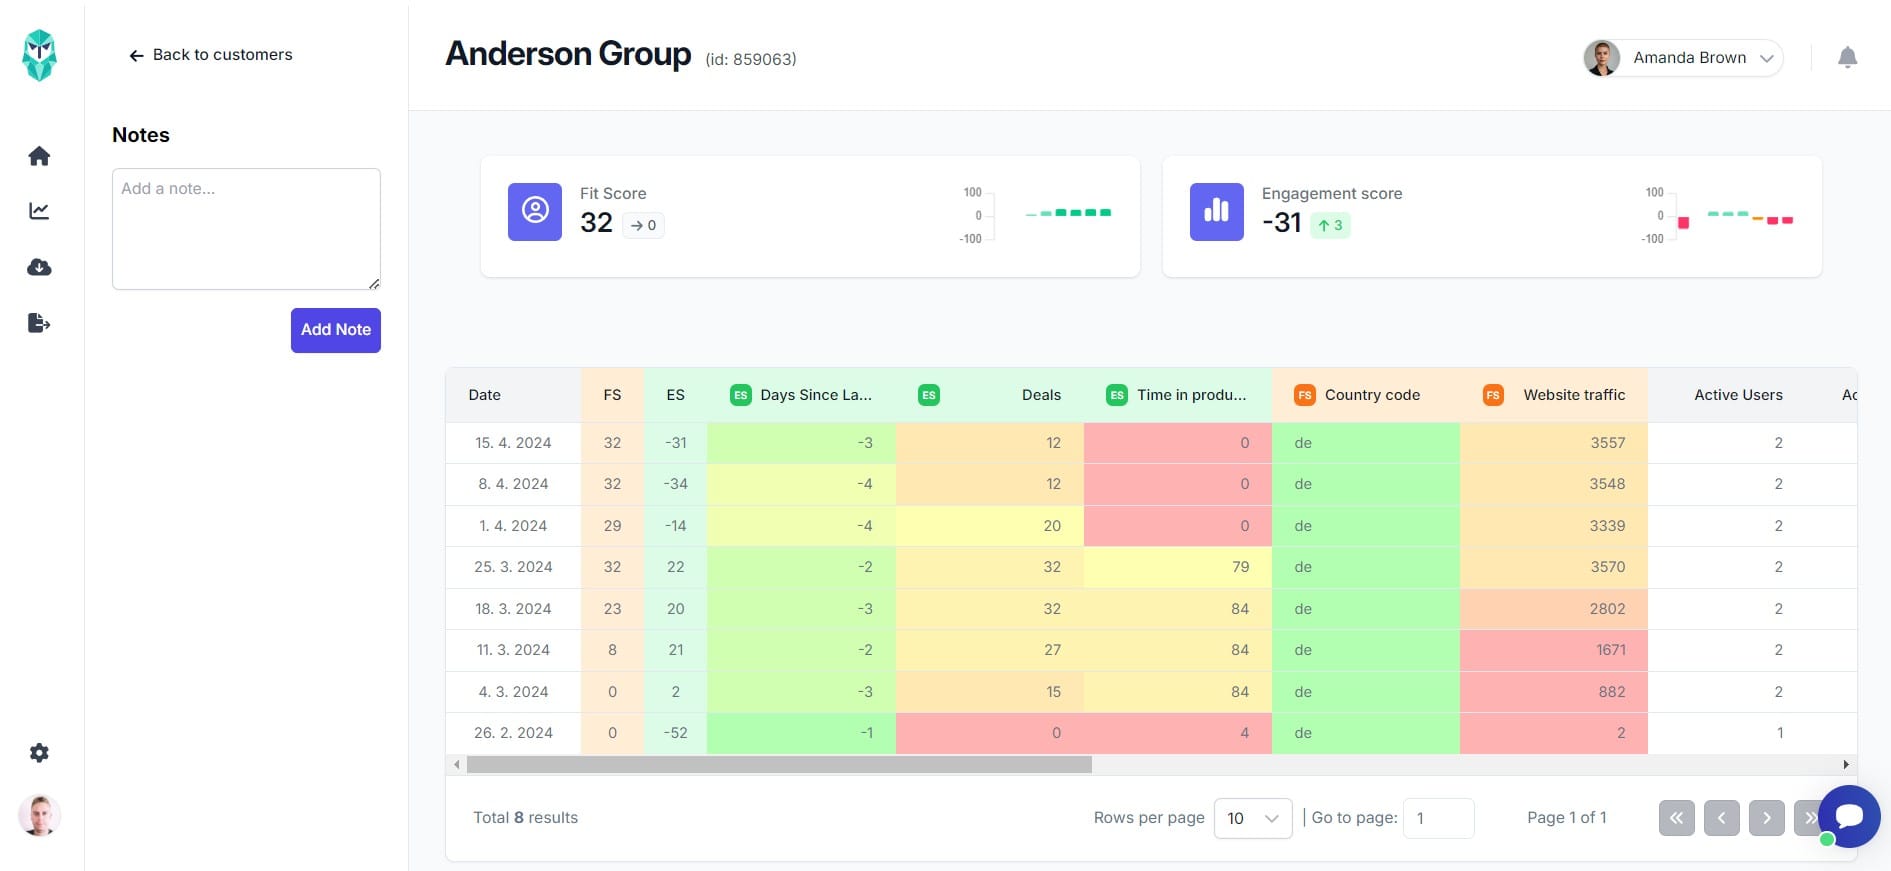
- Left Panel: Here, you will find notes for the given customer. You can read more about notes in the article about Team functions.
- Top Panel: This panel shows the customer's name and ID on the left. On the right, you will see the assigned owner or have the option to assign one.
- Score Cards: Below the top panel, there are two cards displaying the current values of the Fit Score and Engagement Score. These cards also show the difference compared to the previous period (snapshot) and a graph of the score development.
- Customer Table: This table is very interesting. Each row represents one data snapshot, including the date it was uploaded and the Fit and Engagement scores for that date. Columns are sorted by properties related to the Engagement Score, Fit Score, and auxiliary properties.
Heat map
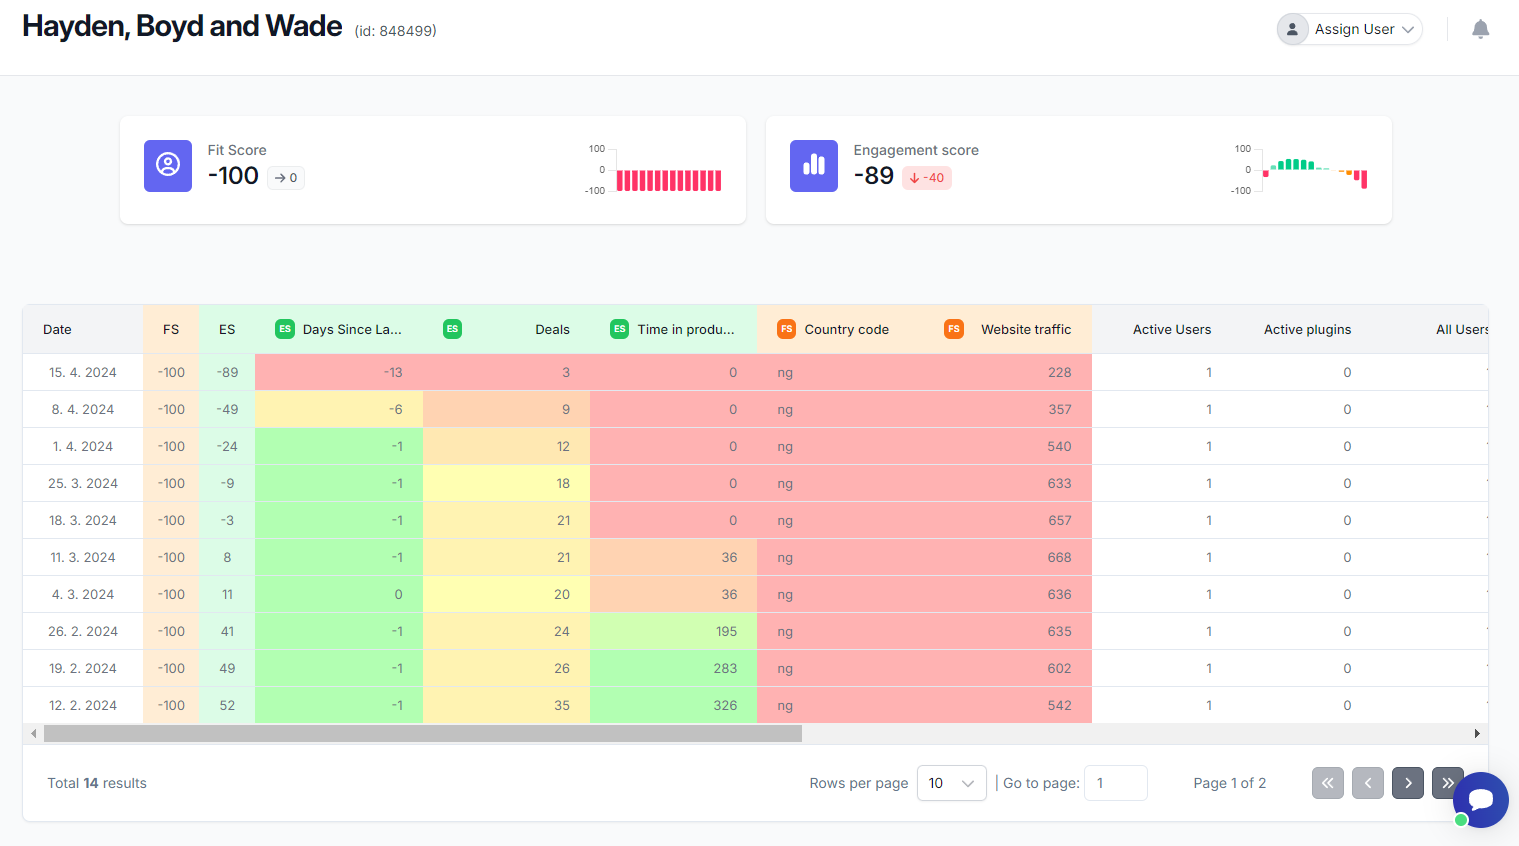
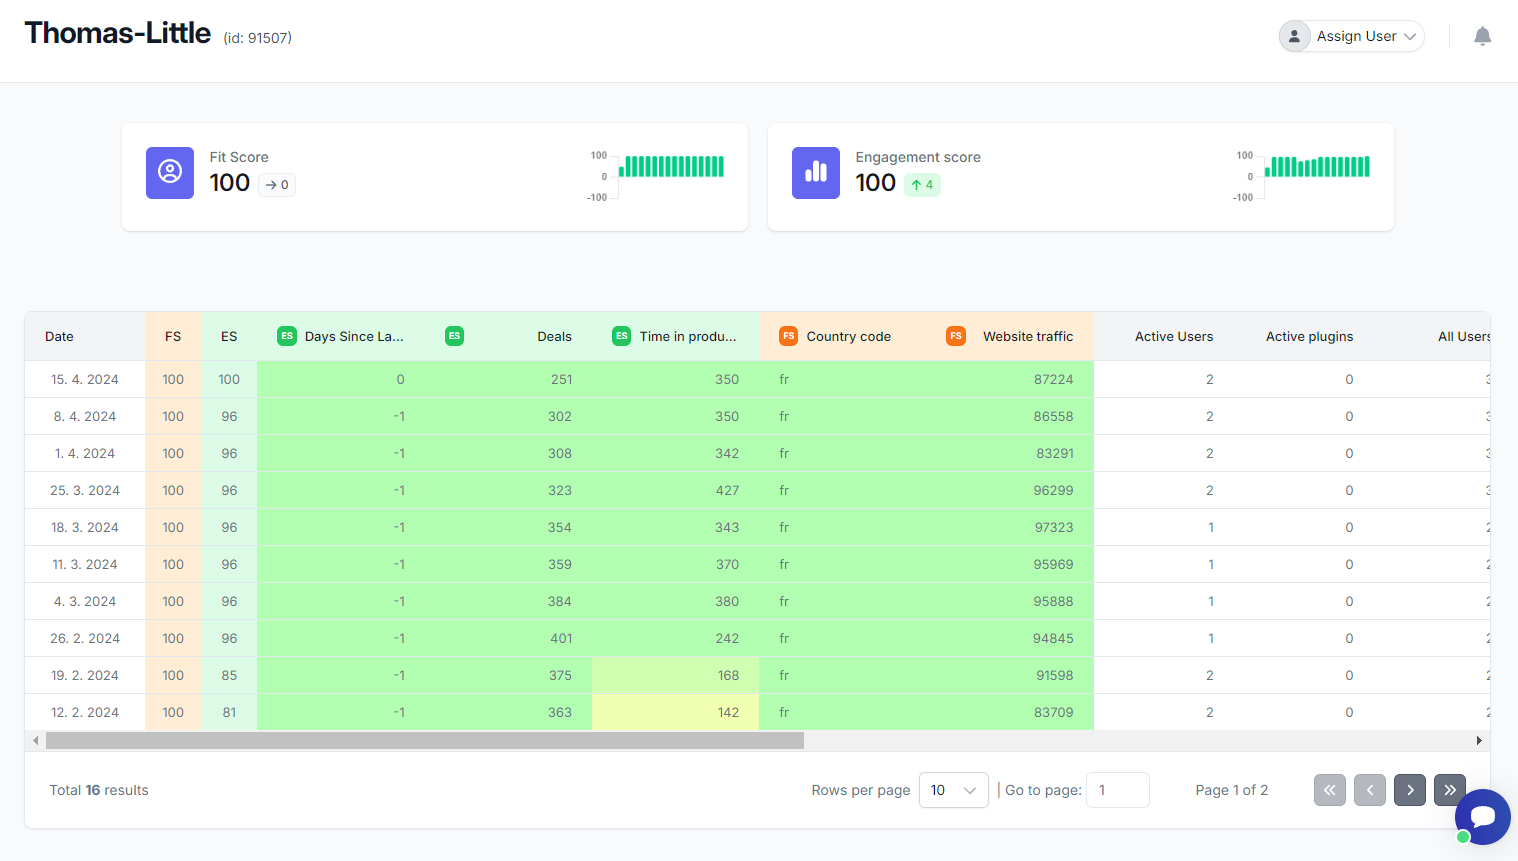
The values in the columns for properties related to Engagement and Fit scores form a heat map. The values are color-coded from green to red: "good" values are green, and "poor" values are red. This allows you to quickly see how the tracked properties of a customer are developing over time and where the customer is improving or worsening. For example, a very "healthy" customer might look like this:
Conversely, a customer likely to stop using your product soon might look like this: