Customers table
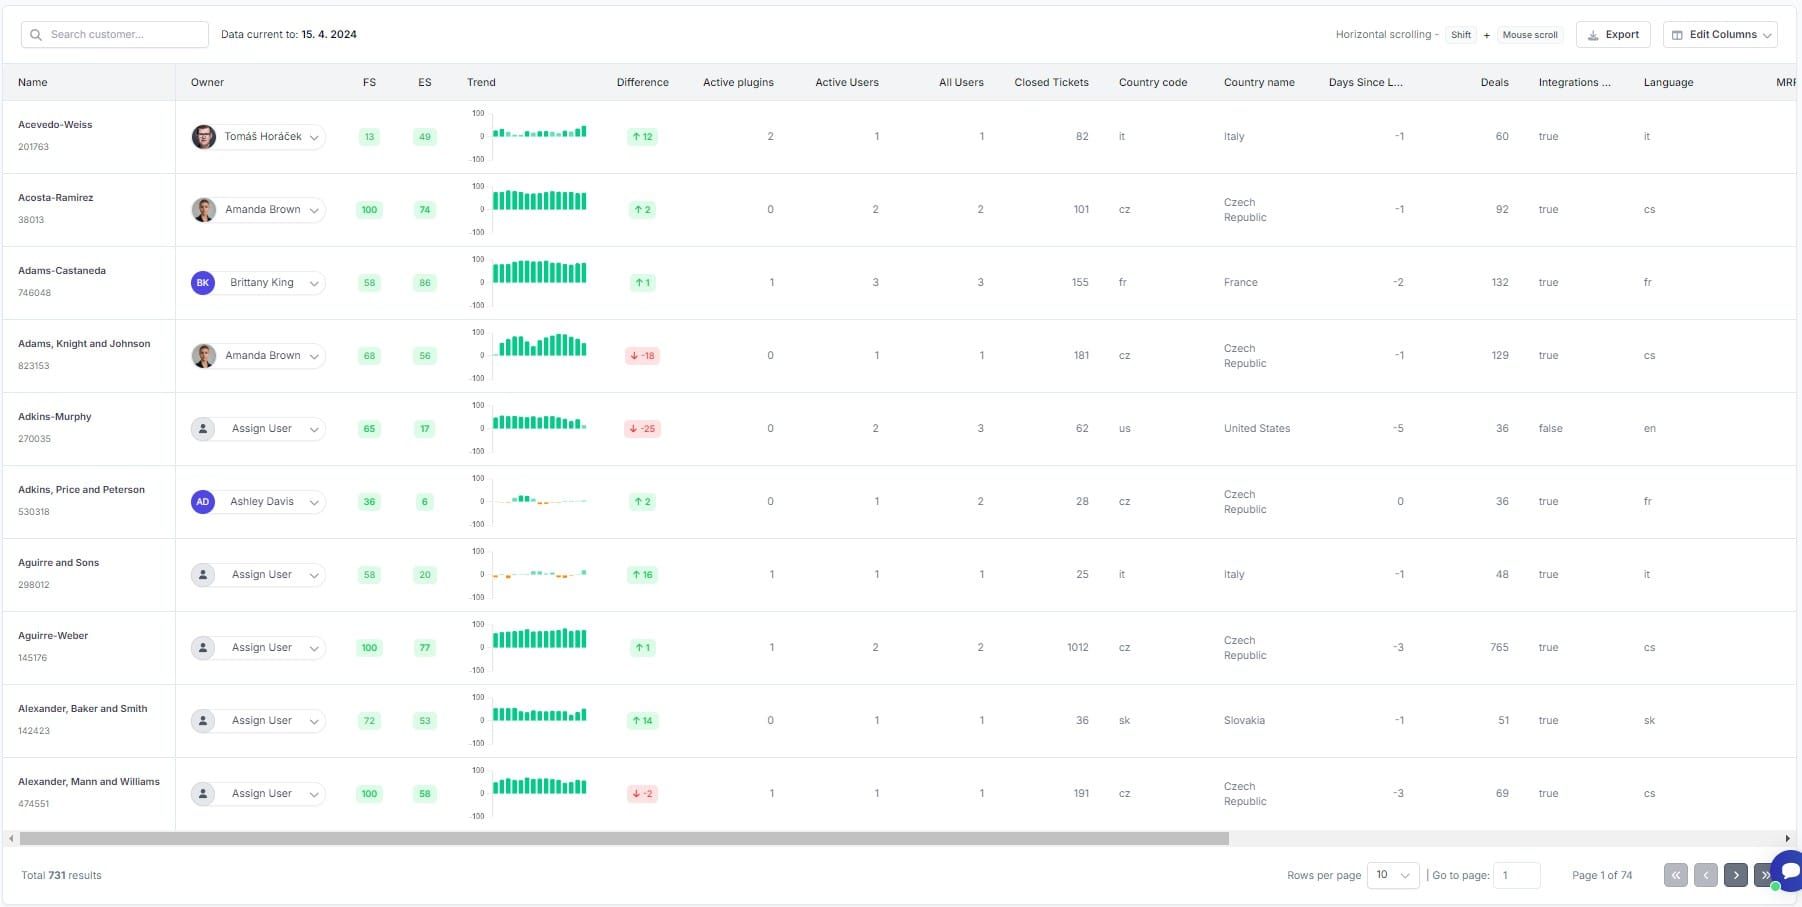
One of the most important elements in the Customerscore.io application is the customer table, which is used for both active and churned customers. Let's take a closer look at the table and its main features.
Overview of the Customer Table
Top Section
- Search: You can search for customers by name or ID.
- Data current to: Shows the date of your last data import.
- Export: Data exporting.
- Column Editing: This will be explained later in this article.
Bottom Section
- Total Customers: The total number of customers is displayed in the bottom left corner.
- Pagination Controls: Located on the right side, these controls help you navigate through pages and set the number of customers displayed per page.
Table Columns
The table has two mandatory columns that cannot be changed:
- Name: Contains the customer's name and their ID below it. Also can contain links to CRM or other links if it is set up. Find more about this in the Customer Links article.
- Trend: Shows the development of the customer's Engagement Score over time with a graph for specific dates.

Other useful columns include:
- Owner: Used to assign a user to a customer. You can read more about this function in the Team Functions article.
- Scores: Columns for Fit Score (FS), Engagement Score (ES), and the Difference in Engagement Score.
- Properties Columns: Unique to each account, showing various properties of your product.
- Last Seen: In the churned customers table, this column shows the date when the customer churned.
Table Functions
The customer table has a variety of handy features. Let's discuss the most important ones.
- Horizontal Scrolling
If your table has more columns than fit on the page, you can navigate by holding the "shift" key and using the mouse scroll.
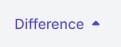
- Sorting by Value
Most columns can be sorted in ascending or descending order by clicking the column header, where a sorting symbol will appear.
- Column Order
You can arrange columns in the order you prefer. This feature is available only for property-specific columns. Click and drag the column left or right with your mouse, and drop where you need it.
- Showing / Hiding Columns
You can also select which columns to display or hide by clicking the "Edit Columns" button in the top right corner. In the overview that appears, you can check which columns to display. Note that the "Name" and "Trend" columns are mandatory and cannot be hidden.
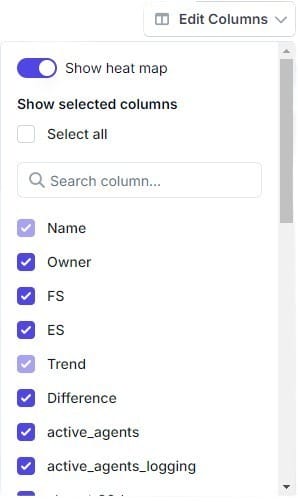
- Heat map
The table also has an option to display data that falls under Fit Score or Engagement Score as a heat map. When this function is enabled, the values are color-coded according to how they compare to the score. The color scale ranges from red (poor) to green (good). You can control the heat map via the "Show heat map" switch after clicking on the "Edit Columns" button. By using the heat map, you can quickly visualize and assess the performance of different metrics, making it easier to identify areas of improvement or success for your customers.